- Hyperliquid (HYPE) climbs above its 200-day EMA after a 3-day rally, up 3% on Monday.
- Open Interest has dropped over 50% since early October, but retail participation is starting to return.
- Technical indicators suggest easing selling pressure, with potential targets at $43 and $48 if momentum holds.
After several choppy weeks, Hyperliquid (HYPE) seems to be clawing its way back up. The token has climbed for three days in a row, now sitting above its 200-day Exponential Moving Average (EMA) — a major technical milestone for trend watchers. As of Monday, HYPE is up about 3%, signaling that selling pressure might finally be easing off. Still, declining activity across the decentralized exchange hints that demand from traders hasn’t fully returned just yet.
Network Data Reveals Slowing Activity
On-chain data shows traders are still jittery after the October 10 flash crash, which wiped out nearly $19 billion in liquidations across the crypto market. According to official stats, Hyperliquid’s total Open Interest (OI) fell from $15.1 billion on October 9 to $7.2 billion by Friday — more than a 50% decline. That kind of drop usually reflects a risk-off environment, where traders close positions instead of adding new ones.
Inflows also took a hit, dropping to $4.5 billion by week’s end as outflows mounted. If this pattern keeps up, Hyperliquid might face a noticeable slowdown in user engagement — not ideal for a DEX that thrives on high turnover.
Interestingly though, the Hyperliquid Assistance Fund has stepped in, purchasing about 33.53 million HYPE tokensworth roughly $1.29 billion. The move, built on a revenue-based buyback model, suggests internal confidence in the project and helps reduce circulating supply — a strategy often used to stabilize price and support long-term growth.
Retail Interest Starts to Pick Up
Despite weaker overall activity, retail traders seem to be tiptoeing back in. Data from CoinGlass shows that HYPE Open Interest rose 2.45% in the last 24 hours to $1.34 billion. That jump could mean traders are ready to take on more risk, either through leveraged longs or renewed speculative bets.
This renewed interest, though modest, might be just enough to keep the momentum going in the short term. If OI continues climbing while outflows ease, sentiment could flip more decisively in favor of the bulls.
HYPE Price Targets and Technical Outlook
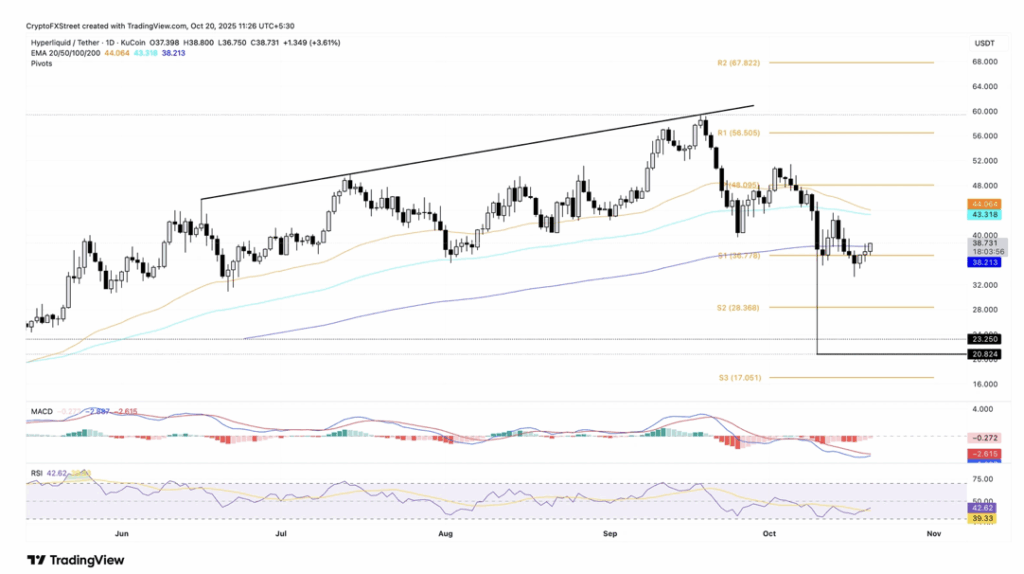
Technically, things are looking better. HYPE has reclaimed its 200-day EMA at $38 — a level often watched as the line between bullish and bearish trends. If the price closes convincingly above this line, the next targets sit at the 100-day EMA ($43) and Pivot Point resistance near $48.
Momentum indicators also support a gradual recovery. The MACD is curling up toward a potential bullish crossover, which would confirm rising momentum. Meanwhile, the Relative Strength Index (RSI) has climbed to 42 from oversold territory, showing that selling pressure is fading.
On the downside, losing support at $38 could drag HYPE back toward $28, the next key pivot zone. For now, though, the trend looks cautiously optimistic — with technicals hinting that the worst might be over, at least for now.