- Hyperliquid is showing early signs of a trend reversal after a 28% drop, with bullish patterns forming on the 4-hour chart.
- On-chain signals like exchange outflows and liquidation pressure suggest growing bullish sentiment and accumulation.
- A breakout above $39 could trigger a short squeeze and push HYPE up to $42.60, but mixed signals from Supertrend hint at some caution.
After taking a nasty 28% dip from its all-time high last month, Hyperliquid (HYPE) might finally be turning the corner. A fresh wave of bullish energy is creeping into the charts — and while trading volume’s still kinda soft, some folks are already calling this a reversal.
Price Wiggles & Market Mood
As of now, HYPE is trading at $38.48, up around 1.85% in the last 24 hours. Not exactly fireworks, but hey — green is green. What’s more interesting is that trading volume’s down 45%, which might sound bad, but also usually means… people are waiting for something.
And then there’s this: one crypto analyst on X (formerly Twitter) pointed out that HYPE just flashed a TD Sequential buy signal on the 12-hour chart. If you’re into patterns and tea leaves, that’s typically one of those signs bulls pay attention to.
Charts Are Talking: Will It Break?
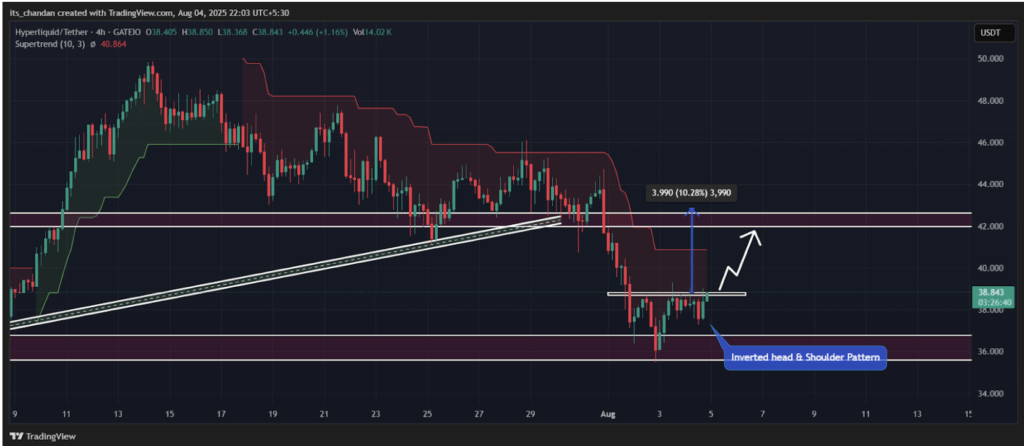
Zoom into the 4-hour chart and you’ll notice something pretty textbook — an inverted head-and-shoulders pattern. That usually screams reversal. The neckline of that setup sits right around $39 — if HYPE can close above that on the 4H candle, we could be looking at a jump to about $42.60 (a neat 10% move).
Key support to keep an eye on? Around $35.70 — that’s where this bullish action seems to be rooting itself.
Now, a little wrinkle: the Supertrend indicator is flashing red on the 4-hour timeframe (which usually means sell pressure), but on the hourly chart? It’s flipped green. So yeah, mixed signals. This thing might be trying to turn the tide… or just pulling a short-term bounce inside a longer downtrend. Time’ll tell.
On-Chain Data: Bulls Sneaking In?
Behind the scenes, things look… interesting. According to Coinglass, exchanges saw $502K worth of HYPE flow outover the past 24 hours. That’s usually a sign folks are pulling tokens off exchanges to hold — a classic accumulation move.
Add to that: the liquidation map shows big pressure around $36.85 and $39.10. At the upper band, there’s $2.29M in short positions on the edge of liquidation. If the price pushes above $39 and liquidates those shorts? Could fuel a mini rally real fast.
Longs are a bit heavy too — sitting at $7.33 million, which means leverage is piling up. So yeah, it’s looking bullish… but don’t sleep on the volatility.