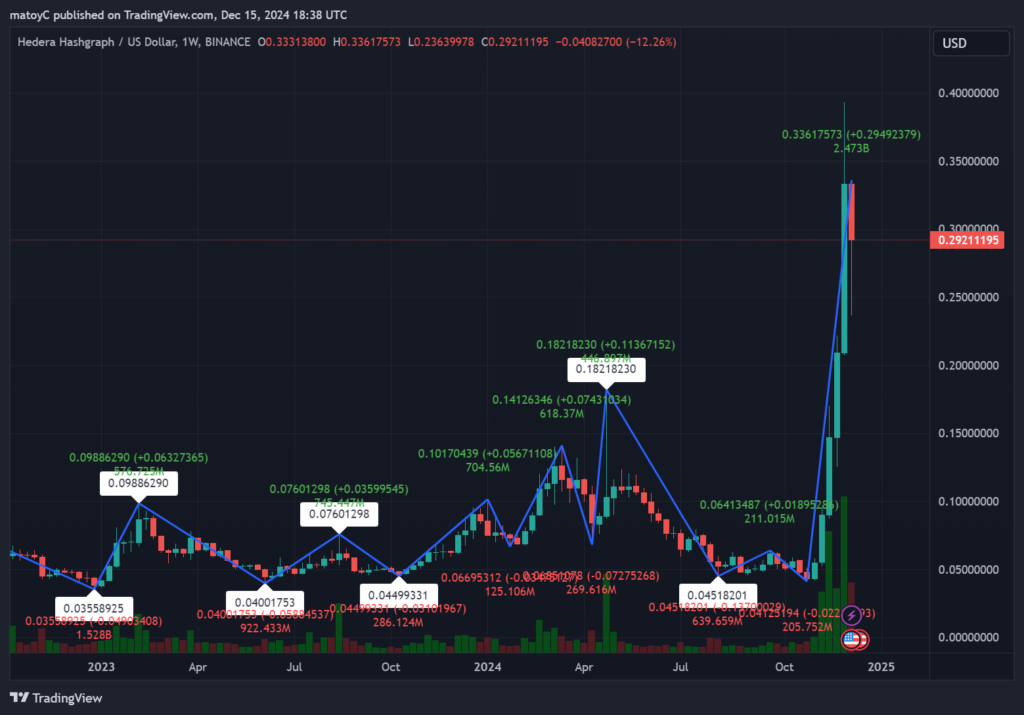
- Hedera (HBAR) surged to $0.3361 before dropping to $0.2910, recording a 12.58% decline.
- HBAR witnessed a significant 650% gain since its October low, supported by rising trading volume.
- Support lies near $0.25, while $0.34 remains a critical resistance level for further upward momentum.
Hedera Hashgraph (HBAR) displayed remarkable bullish momentum on its weekly chart, reaching a high of $0.3361 before retracing to $0.2910. The TradingView chart highlights an extended rally that began in October 2023, where HBAR traded as low as $0.045, signaling an almost 650% price increase in just over two months.
The sharp upward move has been accompanied by increased trading volume, reflecting growing market interest and strong buyer participation. However, the most recent candlestick reveals signs of a pullback as traders look to lock in profits. HBAR’s inability to maintain its peak suggests that resistance at $0.34 remains firm, presenting a short-term challenge for buyers.
Breakout Followed Prolonged Accumulation
HBAR’s breakout came after months of price accumulation, where the asset traded between $0.04 and $0.07 for much of 2023. The breakout began in late October when buyers pushed the price past key resistance levels, triggering a steep upward climb. This bullish momentum culminated in December with a rapid move to $0.3361, marking the highest point HBAR has seen this year.
The current retracement, marked by a 12.58% drop to $0.2910, reflects some cooling in market sentiment. Support levels around $0.25 will now play a critical role in determining the next direction for HBAR. If buyers maintain control, a consolidation phase could prepare HBAR for another attempt at breaking the $0.34 resistance.

Market Signals Indicate Caution
Technical indicators on the weekly chart show mixed signals. While the steep price increase suggests strong bullish momentum, the Relative Strength Index (RSI) has entered overbought territory, which often signals a potential slowdown. Traders are now watching for confirmation of a support level to assess the possibility of a new leg upward.
The rising trading volume remains a positive sign, as it highlights strong interest from both retail and institutional participants. If HBAR holds above $0.25, further bullish movement remains likely, with $0.40 emerging as the next long-term target.
In summary, Hedera’s weekly performance reflects a strong rally driven by renewed market enthusiasm, but caution remains as profit-taking introduces short-term volatility. Support and resistance levels around $0.25 and $0.34 will be critical in defining HBAR’s price movement in the coming weeks.


