
- HBAR bounced nearly 2% from $0.2288 support but faces mixed technical signals.
- Open interest fell below $400M, showing capital outflows, yet taker buys and long/short ratios hint at cautious optimism.
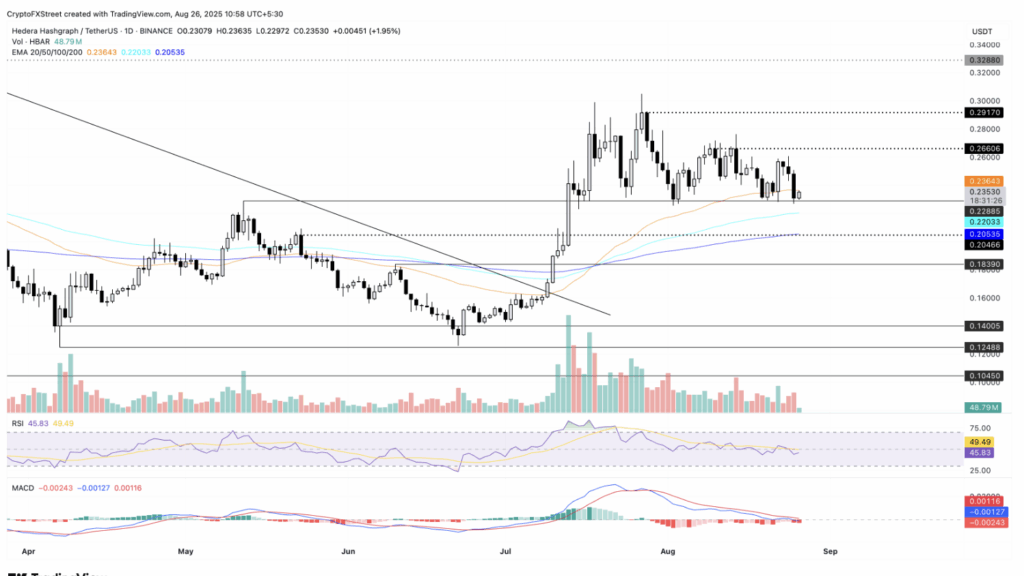
- A close above the 50-day EMA could send HBAR toward $0.2660, while losing support risks a slide to $0.2203.
Hedera (HBAR) managed to tick higher by nearly 2% on Tuesday, snapping a rough three-day losing streak. The token rebounded from a crucial support level, giving bulls a bit of breathing room even as open interest keeps slipping. For now, though, the charts look a little indecisive, leaving room for both consolidation and another move lower.
Derivatives Show Conflicting Signs
Fresh numbers from CoinGlass reveal that Hedera’s open interest (OI) slid back under the $400 million mark, settling around $391.8M compared to $409M just the day before. That dip points to traders pulling money out of HBAR derivatives, likely tied to recent liquidations.
Even so, sentiment isn’t completely in the gutter. Taker buy volume climbed to 48.55% from 47.63% the day before, and the long-to-short ratio inched up to 0.9436. Basically, some traders are leaning back toward the bullish side, even as overall positioning looks lighter than last week.
Price Action Fights to Reclaim EMA
On the spot side, HBAR bounced cleanly off $0.2288 support, marking a near 2% lift on the day. That move cut short the recent losing streak and put eyes back on the 50-day EMA at $0.2364. A solid close above there could open the door for a run toward $0.2660, last seen in mid-August.
Still, momentum is shaky. The MACD and signal line are hovering dangerously close to flipping under the zero line, which would flash a sell signal and hint at further bearish momentum. Meanwhile, the RSI sits at 45, hovering just under neutral — not exactly a screaming buy signal.
What’s Next for HBAR?
If buyers can keep defending the $0.2288 level, Hedera has a shot at reclaiming lost ground. But if that line gives way, downside pressure could drag it back to the 100-day EMA at $0.2203. Traders watching the charts are caught between a hopeful bounce and the risk of another breakdown — the next few sessions should make the direction a lot clearer.