
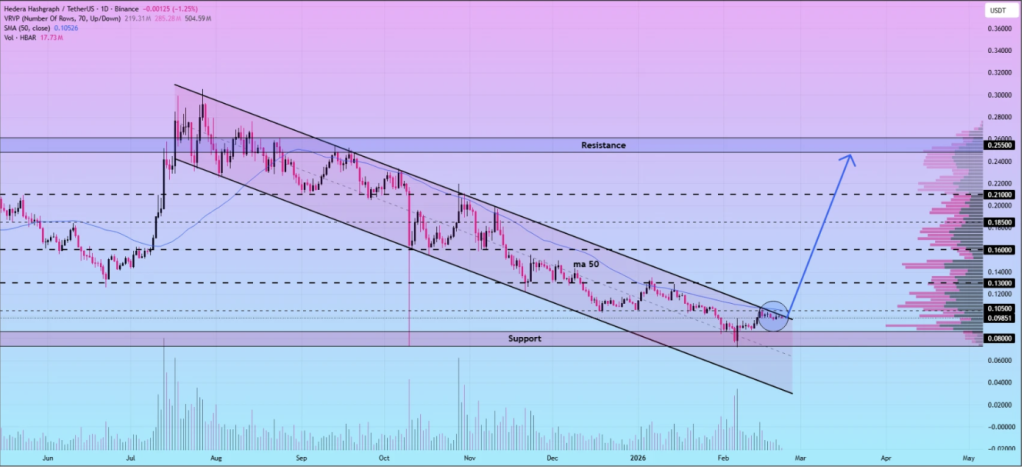
- HBAR is pressing against the upper boundary of a descending channel, signaling a potential breakout or rejection point.
- Key upside levels include $0.130 to $0.255, but failure to break resistance could extend the current downtrend.
- Weekly EMAs, RSI near 34, and a negative MACD suggest broader bearish pressure still dominates.
Hedera is back on traders’ radar this Sunday, February 22, and not quietly either. HBAR is testing the upper boundary of a descending channel on the daily chart, a structure that has dictated price behavior for weeks now. According to crypto analyst Profit Demon, price is right at resistance, pressing into it, almost leaning.
Descending channels usually suggest continuation of a downtrend. Lower highs, lower lows, controlled movement downward. But when price pushes into the upper boundary repeatedly, it creates tension. That tension often becomes a decision point. Break out, or roll over again.
Volatility is compressing near that resistance line. Traders know what that means. When price coils like this, the next move tends to expand sharply. The question is direction.
Breakout Targets Versus Rejection Risk
If HBAR manages to break above the descending channel with conviction, the short-term structure changes. Selling pressure weakens, demand strengthens, and speculative capital often follows. Analysts have outlined several upside levels that could come into play if momentum builds.
Commonly mentioned targets include $0.130, $0.160, $0.185, $0.210, and $0.255. These levels aren’t random. They represent prior consolidation zones, liquidity pockets, and psychological thresholds where traders previously reacted. Markets have memory.
However, Profit Demon has cautioned that resistance here is real. If price fails to clear the channel cleanly, another wave of selling could emerge. A rejection at this level would reinforce the existing downtrend and potentially push HBAR back toward lower support areas. This is not a guaranteed breakout. It’s a pressure test.
Broader Trend Still Leans Bearish
Looking at the bigger picture, the weekly structure remains heavy. Earlier in 2025, HBAR staged a sharp rally, climbing above the 20, 50, 100, and 200-week EMAs in an impressive run. That momentum didn’t hold.
Price gradually slipped back below those moving averages and is now trading around $0.097, under all major weekly EMAs. That positioning keeps the broader trend technically bearish. Until those levels are reclaimed, rallies risk being corrective rather than transformational.
Momentum indicators reinforce caution. The RSI sits near 34.8, drifting toward oversold territory. It hasn’t fully bottomed, but it’s weak. The MACD remains negative, with the signal line below the MACD line, confirming downside pressure still lingers.
So HBAR stands at a crossroads. Short-term structure hints at a potential breakout attempt. Long-term indicators still point down. Traders are watching closely now, because what happens at this descending channel could shape the next chapter for Hedera.