
- HBAR bounced 2.6% in 24 hours but remains down 7% monthly.
- Short-term charts show dip buying and fading bearish pressure.
- Holding $0.210 support is crucial — reclaiming $0.235–$0.249 could trigger a bigger rally.
HBAR is finally waking up again, climbing about 2.6% in the last 24 hours to trade near $0.219. Even with that little bounce, the token is still down roughly 7% over the month. Step back though, and the story changes — HBAR is up more than 330% in the past year, which keeps the bigger trend leaning bullish. The daily setup still feels fragile, but a few early signals hint that bears might be starting to lose their grip.
Short-Term Buyers Step In
On the 4-hour chart, the Money Flow Index (MFI) has quietly been pushing higher. What’s interesting is that it’s been printing higher highs even while HBAR’s price was drifting lower. Usually, this kind of divergence shows up first on lower timeframes as dip buyers creep in before the daily charts confirm it. If MFI can push above its recent high around 35.90, that would be a stronger sign that accumulation is already in motion.
At the same time, the Bull–Bear Power (BBP) indicator has been sliding since early September, showing that sellers are losing steam while buyers pick up the slack. Put together, these signals don’t mean the rally is locked in yet, but they do suggest that sentiment is slowly shifting in favor of the bulls.
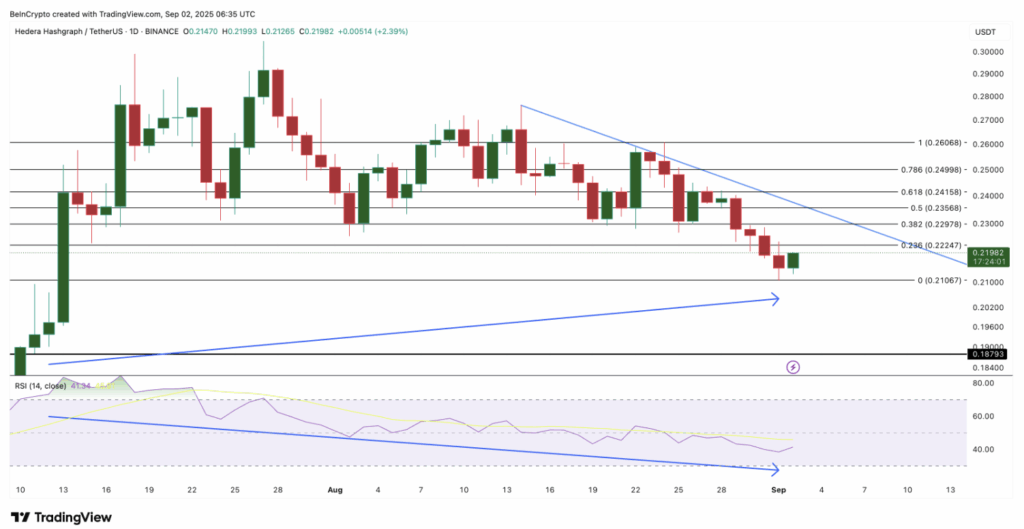
Daily Chart Paints a Bigger Picture
Looking at the daily timeframe, HBAR is still stuck inside a descending triangle pattern. Key support rests at $0.210 — lose that, and price could tumble toward $0.187 pretty quickly. On the flip side, if bulls can reclaim the $0.235–$0.249 area, it would be the first real clue that bearish control is breaking down.
Adding some weight to the bullish case is a hidden divergence on the RSI. Between July 13 and September 2, HBAR set a higher low in price while RSI carved out a lower low. That’s often read as a continuation signal — basically saying the broader uptrend hasn’t gone anywhere, even if short-term momentum looks rough.
What to Watch Next
For now, it’s all about whether buyers can defend that $0.210 floor and then push back toward the $0.235–$0.249 pocket. If they succeed, the divergence plus the yearly uptrend could be enough to spark a more sustained rebound. Fail to hold $0.210 though, and sellers could drag HBAR back into deeper correction territory before bulls get another shot.