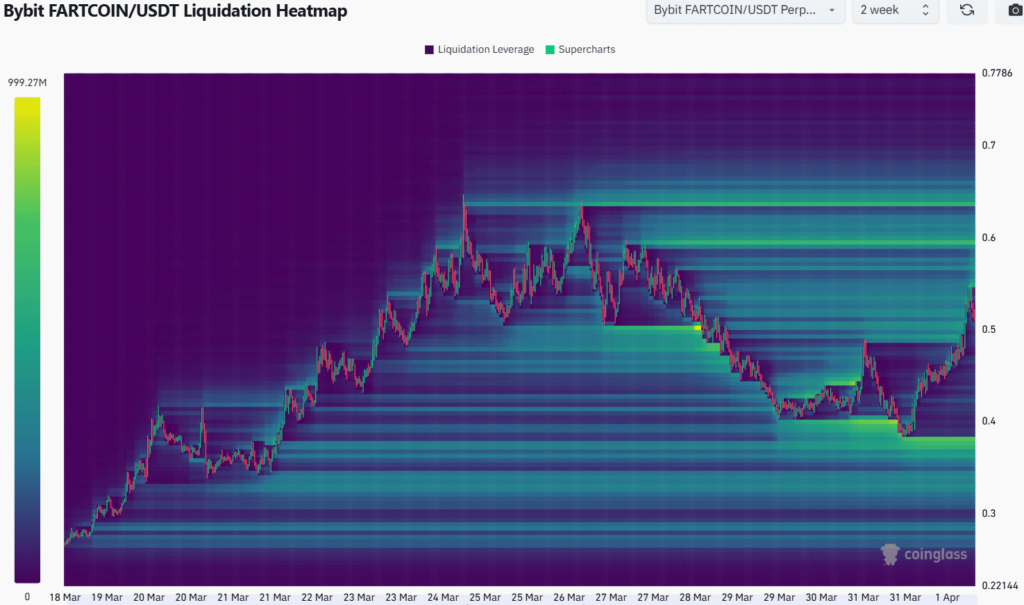
- Eyes on $0.63–$0.64, with potential for more if bulls keep the wheel.
- FARTCOIN dumped 40% thanks to Bitcoin, then bounced 35% in a day.
- Chart signals are leaning bullish, especially with that moving average crossover and volume activity.
Fartcoin (yep, still a real thing) was looking like it might start climbing again, y’know, forming an actual uptrend. But then Bitcoin did its usual mood swing—went bearish—and dragged FARTCOIN down with it. Hard. We’re talking a 40% nosedive.
That dip hit bottom on March 31, and just a day later, the coin bounced back 35% from the lows of $0.383 on April 1. No joke. April Fools’ rally?
Bulls Show Up—Maybe a Bit Late, But They’re Here
Zoom out to the daily chart and things are… kinda spicy. On March 28, the 20-day and 50-day moving averages crossed over in a bullish signal. Classic golden crossover vibes.
Since then? That 20-day moving average has basically acted like a soft pillow for price—keeping it from falling too far.
Now, CMF (Chaikin Money Flow) did try to flex above +0.05—hinting that big money was flowing in—but it chickened out and slipped back to neutral. Still, not all bad: the OBV (On-Balance Volume) is this close to breaking its late-February highs.
Translation? There’s buying pressure building up. Not crazy strong, but steady. Enough that bulls have a case to make.
Price already bulldozed through the $0.3615 resistance, flipping it into support, which is a big deal. That move basically shouted “hey, we’re back.” If momentum holds, $0.619 could be next in line to get flipped.
4-Hour Chart Says: Mid-Range Battle Incoming
Shorter timeframe paints a slightly messier picture. FARTCOIN’s been bouncing inside a range lately, with $0.508 being kind of the “meh” middle point. It’s been support before, but might act as resistance again soon.
The CMF on this chart isn’t exactly partying—likely thanks to that chunky drop from $0.63 to $0.39. That move basically defined the current range.
But bulls are breathing a little easier—RSI just pushed above neutral 50, which usually signals strength coming back into the game. If FARTCOIN can flip that $0.508 zone into support again, things could heat up quick.

Liquidation Map Hints at One Direction (and No, Not the Band)
Looking at liquidation zones—there’s a lot of juicy liquidity stacked at $0.556, $0.60, and $0.64. Basically, price likes to gravitate toward where the most money’s at. And right now? That’s above us.
There is a liquidity zone below, but it’s kinda far away and about the same size as the ones on top. Which tells us—short-term, at least—FARTCOIN probably has more upside than downside.
If it rallies, traders are eyeing that $0.63 level again. Maybe even a breakout beyond that if momentum keeps up and Bitcoin doesn’t drag everyone down again.


