Price movements in the crypto space serve as necessary signals for investors, traders, and speculators alike. During the 2021 bull run, price analysis acted as one of the main catalysts for new investors to get onto the crypto bandwagon as top coins hit new all-time highs and new money flooded the market. Fast forward to September 2022, and the market may see this increased flow of funds return more rapaciously than ever before, especially with Ethereum (ETH) displaying strength in the days leading up to the transition to the proof-of-stake (PoS) consensus mechanism.
Ethereum Price Escapes From A Falling Wedge
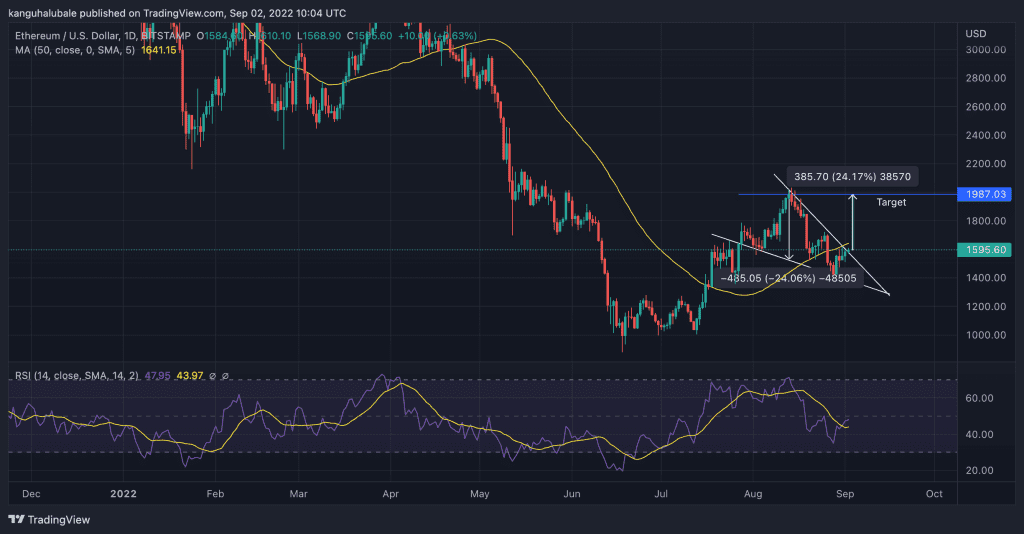
ETH price action has formed a “falling wedge” pattern on the daily chart setting the stage for a 24% breakout from the current price.
A falling wedge is a significantly bullish technical chart pattern formed when the price trends lower inside a descending triangle.
It is typically confirmed when the price breaks above the upper trendline with the breakout target set as high as the maximum distance between the triangle’s trendlines when measured from the escaping point.
The ETH/USD daily chart shows that the price of the largest altcoin has been contracting since August 13, recording lower highs and lower lows within a falling wedge. At the time of writing, Ethereum had escaped from the technical pattern after producing a daily close above the wedge’s upper trendline at $1,567 on Wednesday.
The bulls will now try to push the smart contacts token above the 50-day simple moving average (SMA) at $1,640. If this happens, it will bolster the buyers who would make the price higher to reach the bullish target of the chart pattern around $1,987 or the $2,000 psychological level.
An extended bull run could see ETH rise toward the $2,500 psychological limit. This is a crucial level for Ethereum investors in that if it is flipped back into support, it would see the token rise toward the all-time high of around $4,000.

Apart from the bullish chart pattern, the upsloping SMAs and the upward movement of the relative strength index (RSI) validate the optimistic outlook. The change in price strength from 35 on August 28 to the current value at 47 suggests that the buyers have started taking control of the price.
On the flip side, if the price turns down from the current level, it would suggest that bears sell on the minor rallies to the 50-day SMA. The cost of the second biggest crypto may then drop below the $1,500 psychological level and back into the falling wedge.
All Eyes on The Ethereum Merge
As the Ethereum blockchain approaches the most significant moment in its history, investors are anxious and excited about equal measures – understandably so. The Merge is expected to convert Ethereum from the current proof-of-work (PoW) consensus algorithm to the PoS-based Ethereum 2.0, which is expected to reduce the network’s energy consumption by approximately 99.95%. In addition, the introduction of sharding in the first quarter of 2023 is expected to make the platform highly scalable and in line with centralized payment processes like Visa and MasterCard.
Skeptics have likened the Merge to “replacing an aircraft’s engine mid-air,” while advocates refer to the Upgrade as the “game-changer for Ethereum’s adoption.” Despite this divide in opinions, all the preparations for the Merge are almost complete.
Data on the Ethereum Merge Countdown by OKLink shows that the software upgrade is now 98.36% complete. The network’s hash rate stands at 894TH/s. The developers confirmed the final Terminal Total Difficulty (TTD) for the mainnet to be 58750000000000000000000 and that the actual time the Ethereum Merge will go live is only 13 days away – September 15.


