
- Ethereum (ETH) has dropped 65% in three months, with chart patterns and RSI divergence suggesting it could dip further, possibly to the $990–$1,240 range.
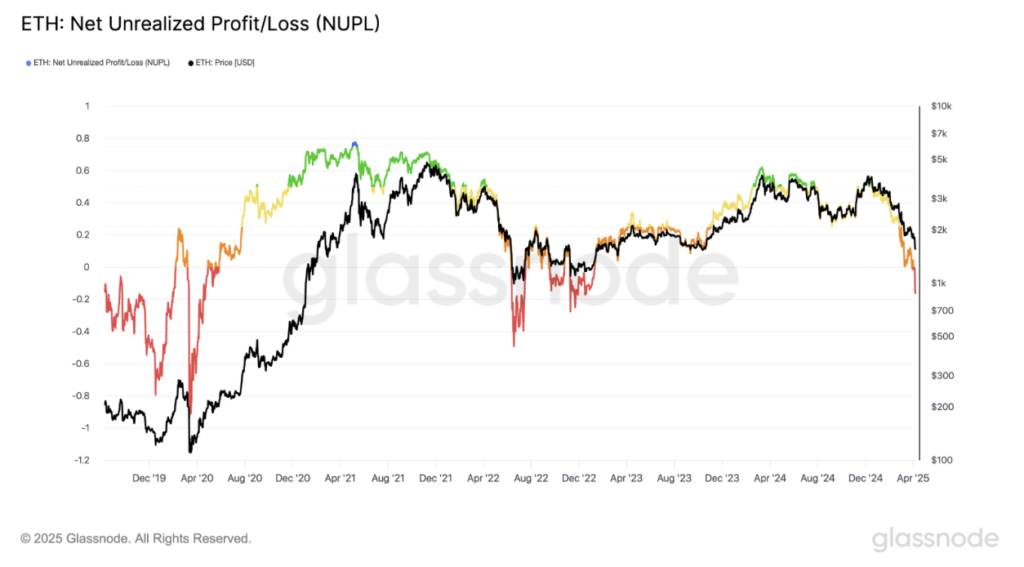
- On-chain data shows ETH’s Net Unrealized Profit/Loss (NUPL) has entered “capitulation”, a zone that historically aligns with market bottoms.
- If patterns from 2018 and 2022 repeat, Ethereum may be nearing the final leg of its correction — with $1,000 acting as a potential bounce zone.
Ethereum’s had a rough few months. After tanking nearly 65% since its recent high, ETH is now trading around $1,431, and investors are starting to ask: is this the bottom — or is there more pain ahead?
While some metrics hint at possible relief, others are flashing red. Let’s dig into it.
History Repeating? ETH Fractals Hint at $1K
Ethereum’s current price action is looking eerily familiar. Analysts are spotting the same fractal patterns from previous cycles — most notably, 2018 and 2022. Both times, a euphoric run-up was followed by a brutal crash and a long cooling-off period.
There are a few consistent clues in each of those cycles:
- Bearish RSI divergence: price makes a higher high, but the RSI makes a lower high — a classic sign that momentum is fading.
- A hard drop through key Fibonacci levels.
- A bottom forming once the RSI falls into oversold territory (below 30), with price finding support in historical zones.
In December 2024, ETH hit a local high around $4,095, but its RSI didn’t follow — instead, it printed a lower high. That red flag was followed by a steep drop. Now, ETH has slipped below the 1.0 Fib level at $1,550, and the weekly RSI is still above 30, which might mean… yeah, more downside is possible.
If the fractal holds true, ETH could drop into the $990 to $1,240 range — lining up with the 0.618–0.786 Fibonacci retracement area.
On-Chain Data Says: Capitulation Is Here
If you’re looking for more signs of a bottom, on-chain data might have something to say.
According to Glassnode, Ethereum’s Net Unrealized Profit/Loss (NUPL) just dipped into “capitulation” territory. That’s the phase where most holders are underwater — holding at a loss — and historically, it’s been a signal we’re near the end of a downtrend.
It happened in March 2020, right before ETH bounced from the COVID crash lows. Again in June 2022, NUPL dropped, and ETH bottomed out near $880 not long after.
And now? Yep — we’re back in that same zone.
If history plays out anything like it did back then, Ethereum might be in the final stretch of this correction, hovering near a bottom somewhere close to that $1,000 mark.
So What’s Next for ETH?
It’s still too early to call the bottom, but the signals are lining up. The fractals are in play. RSI hasn’t bottomed yet. And NUPL? That’s already in the danger zone — or the opportunity zone, depending on how you look at it.
Short-term volatility’s still in the cards. But if ETH slips closer to $1,000, don’t be surprised if we see a turnaround narrative start to build — slowly at first, and then… well, you know how it goes.