
- Ethereum’s Price Decline: Ethereum (ETH) has experienced a significant drop, losing 46.06% over the past year, with the current price around $1,788.
- Technical Indicators Point to Bearish Trends: The formation of a symmetrical triangle pattern and a breakdown with retest suggest strong downward momentum, indicating potential for further losses.
- On-Chain Data Reflects Bearish Sentiment: Declines in futures buy volume to $4.75 billion and large holders’ netflow turning negative at -1.65k indicate reduced investor confidence and increased selling pressure.
Ethereum (ETH) has faced a significant downturn recently, with its price declining by approximately 46.06% over the past year. This decline is more pronounced compared to other cryptocurrencies like Bitcoin, which have shown upward trends during the same period.
Technical Analysis: Symmetrical Triangle Breakdown
The altcoin has broken down from a symmetrical triangle pattern, a technical indicator that often suggests potential bearish movements. This breakdown, coupled with a retest of the pattern’s lower boundary, indicates that ETH might be poised for further losses.
Market Position and Dominance
Ethereum’s market dominance is also under pressure. The cryptocurrency’s dominance has decreased from 17.32% to 7.39%, highlighting its underperformance relative to competitors.
On-Chain Data Insights
- Futures Buy Volume: Ethereum’s futures buy volume has declined to a two-week low of $6.17 billion, down from $16.25 billion. This suggests reduced buying interest among investors.
- Whale Activity: Large holders, often referred to as “whales,” are exhibiting selling behavior. Data indicates that the net flow of ETH among these large holders has turned negative, with an outflow of approximately 1.65k ETH.
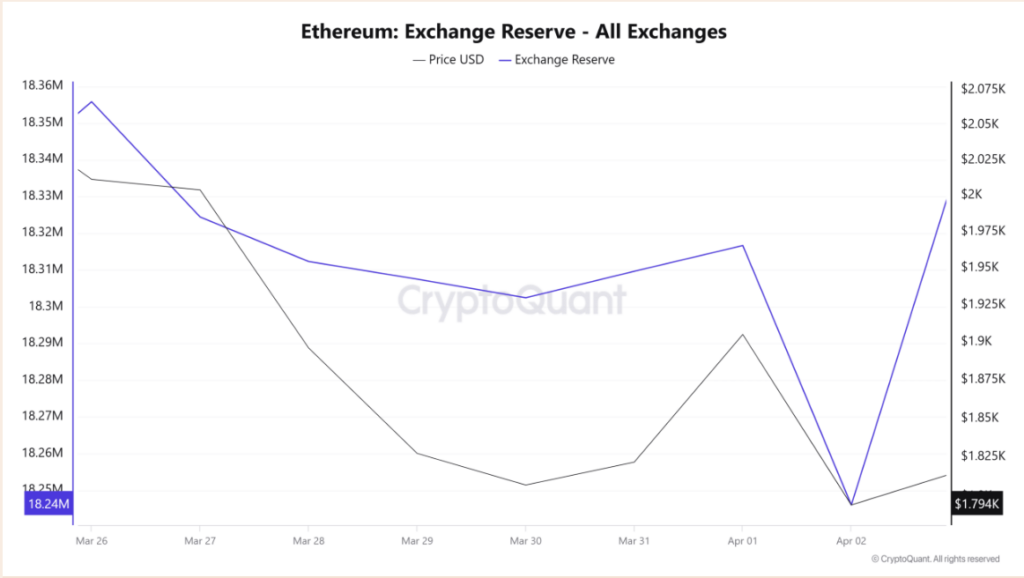
- Exchange Reserves: The amount of Ethereum held on exchanges has increased, reaching 18.4 million ETH—a rise of 200 million tokens in the past day. This uptick implies that more investors are moving their holdings to exchanges, potentially to sell, reflecting a bearish sentiment.
Potential Price Movements
Given the current market conditions and technical indicators:
- Support Levels: If ETH breaches the $1,757 support level, it could decline further to around $1,657, levels last seen in October 2023.
- Resistance Levels: For a bullish reversal, Ethereum would need to achieve a daily close above $1,800.
Conclusion
Ethereum is currently facing significant bearish pressures, influenced by technical patterns, decreased buying interest, increased selling by large holders, and rising exchange reserves. Investors should exercise caution and closely monitor these indicators to inform their decisions.