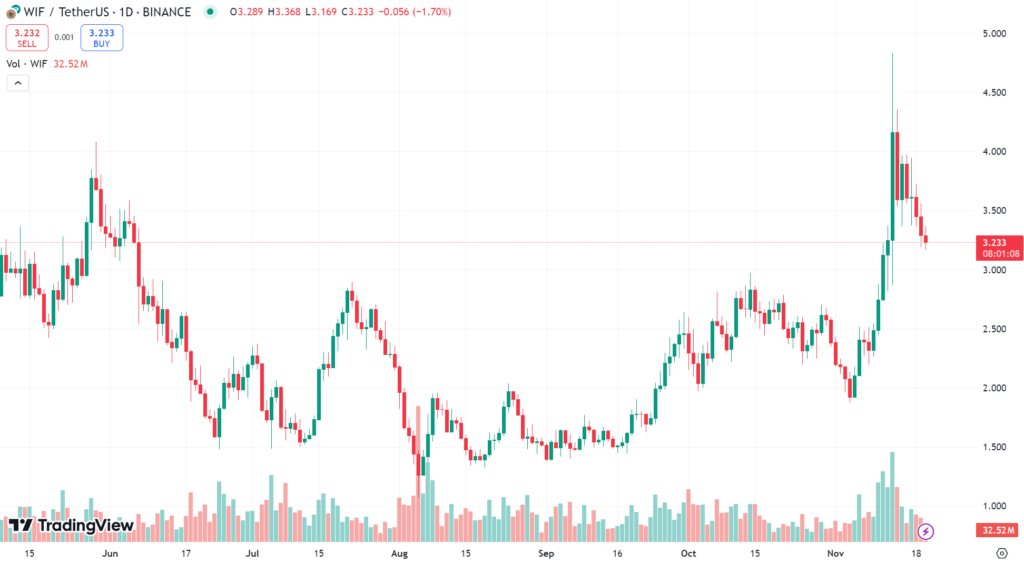
- WIF has dropped below the $3.582 support level, signaling a bearish shift in market sentiment.
- The 1-day RSI has declined from 80% to 64%, indicating reduced buying pressure and potential further losses.
- Critical support zones are at $2.896 and $2.257, with further downside risks if these levels fail to hold.
WIF’s recent price movement has drawn attention as the token fell below the crucial $3.582 support level. This development has raised concerns about a deepening bearish trend, with traders closely monitoring whether the market can stabilize or if additional declines are likely.
Analyzing WIF’s Bearish Momentum
On the daily chart of TradingView, WIF’s price is under significant downward pressure, forming a bearish candlestick pattern that indicates control by sellers. After breaking the $3.582 support level, the token is moving toward the $2.896 range, where the 100-day Simple Moving Average (SMA) could provide a potential stabilization point.
The Relative Strength Index (RSI) on the daily timeframe has dropped from a high of 80% to 64%, signaling a weakening of bullish momentum. This downward trend in RSI suggests that buying interest is diminishing, and traders will be watching for further moves toward lower levels if bearish sentiment continues to dominate.

Source: TradingView
Key Support Zones and Potential Reversal
If the downward trend persists, critical support levels include $2.896 and $2.257. Historically, these zones have acted as stabilizing points where buying interest has returned. A failure to hold above $2.896 could open the door to more significant declines, with psychological levels likely influencing price action.
Conversely, if buyers regain control and the price reclaims the $3.582 level, WIF could see a shift toward a bullish recovery, potentially testing higher resistance zones. For now, market participants are carefully observing the price movement to gauge whether this is a temporary pullback or the start of a broader bearish phase.


