
- DOGE is consolidating below $0.15, with a weekly close under $0.14 risking a deeper fall toward $0.07.
- Long-term symmetrical triangle structure and monthly Ichimoku support still provide a chance for reversal if buyers step in.
- A breakout above $0.18–$0.20 would confirm recovery, while failing support could send price toward multi-year lows.
Dogecoin has been wobbling its way through a pretty tense consolidation phase, with price still stuck under $0.15 and pressing deeper into long-term support territory. Traders are basically watching every candle at this point, trying to figure out whether DOGE can somehow rebound toward $0.18, or if the market is gearing up for another leg down.
Right now DOGE trades around $0.138, slipping about 3% in 24 hours. Daily volume sits at $6.17B, a bit softer than its 30-day average — signaling a slowdown in participation as the market sorts itself out. The pressure isn’t isolated either; most major assets have been under heavy sell volume all week.
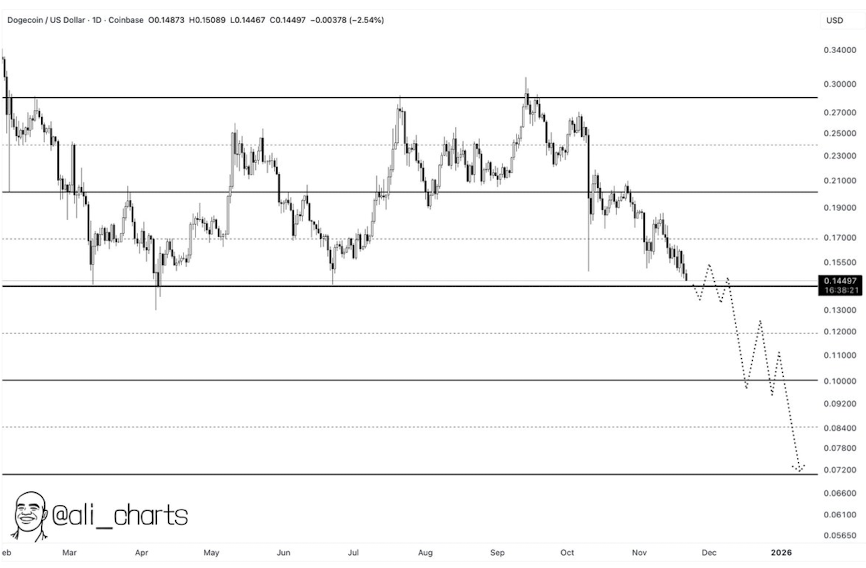
A weekly close below $0.14 could get ugly
Analyst Ali (@ali_charts) warned that if DOGE fails to hold $0.14 on the weekly timeframe, the door opens to a brutal slide toward $0.07, a macro support that hasn’t been tested in ages.
That projection assumes continued selling, fading higher lows, and a structure that just refuses to flip bullish. But Ali did note that if RSI slips into oversold territory — below 30 — a rebound could build from that $0.07 zone… assuming buyers don’t vanish.
A giant symmetrical triangle still defines DOGE’s long-term structure
On the weekly chart, DOGE has been forming a huge symmetrical triangle since 2021:
- Higher lows suggest accumulation, not a breakdown
- Lower highs reflect long-term selling pressure
- Volume keeps tightening — classic pre-breakout compression
DOGE is now retesting the rising support line from its 2021 lows. If it breaks above the triangle apex with strong volume, the move could be explosive. But if it loses support? The bearish scenario toward $0.07 becomes a lot more realistic.
Short-term: DOGE is trapped in a tight $0.1300–$0.1350 range
Daily charts show Dogecoin chopping inside a tiny range that’s starting to look like accumulation — but in a bearish context. The upside lid remains at $0.1500–$0.1550, and nothing meaningful happens unless DOGE clears that zone.
Worst case, monthly structure points to a retest of $0.0900–$0.0950.
Best case, a clean break above $0.18 starts flipping the trend.
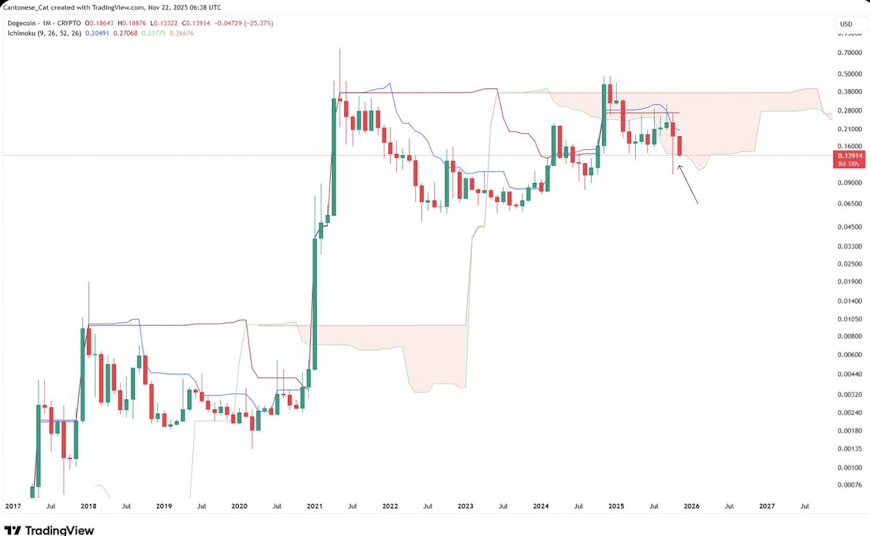
Monthly Ichimoku shows DOGE sitting on major historical support
Analyst Cantonese Cat (@cantonmeow) pointed out that DOGE is hugging the lower edge of the monthly Ichimoku cloud — a zone that has acted as multi-year dynamic support.
He also highlighted:
- The 0.5 log Fibonacci level
- The 200-week SMA
Both act as heavy long-term supports that could help DOGE rebound toward $0.133 if macro conditions cool off. With a bit of humor he added, “Dog’s still in the house,” even as long-term structure gets tested hard.
Critical levels to watch
Upside:
- $0.1500 → must reclaim to avoid deeper trouble
- $0.18–$0.20 → breakout zone if momentum returns
Downside:
- Weekly close < $0.14 → opens path to $0.07
- Breakdown confirmed if volume expands and multi-year trendlines fail
Everything now depends on volume, volatility, and whether bulls can finally defend a higher low.
Final thoughts
Dogecoin is in a fragile consolidation zone, with both bullish and bearish scenarios still very much alive.
At press time, DOGE traded around $0.14, down 6.48% in the last 24 hours. A rebound toward $0.18–$0.20 is possible — but only if DOGE breaks resistance with momentum behind it.
Lose the current support, though, and the market could be staring down far lower macro levels. Traders should keep an eye on the triangle support, weekly close levels, and volume trends, as those will decide which direction DOGE takes next.