
- DOGE is up around 2.7% this week despite whale activity falling to its lowest level in two months.
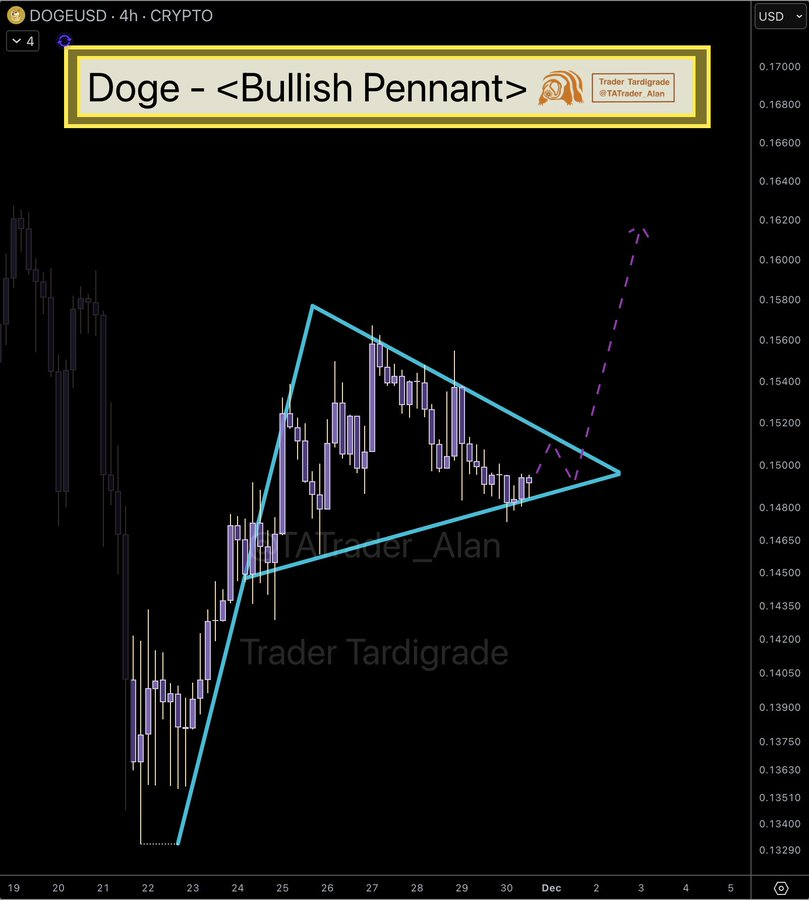
- A bullish pennant on the 4-hour chart hints at a potential breakout if buyers step in.
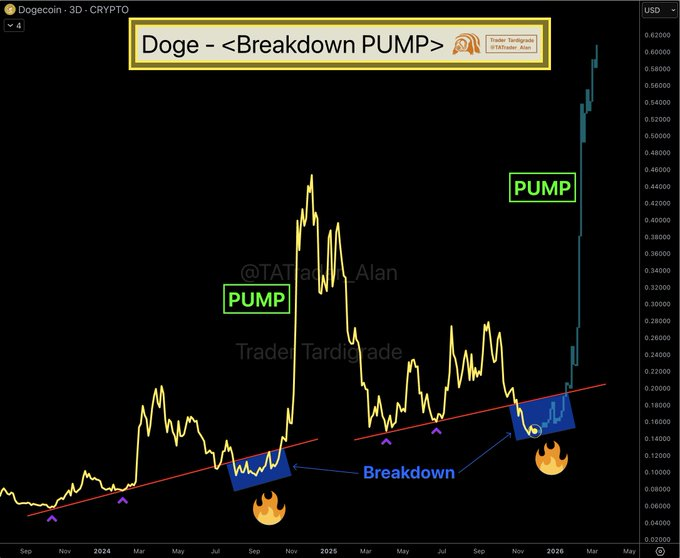
- The 3-day chart shows another classic DOGE fake-out breakdown, a pattern that has historically led to strong rallies.
Dogecoin has been acting a little strange lately — price pushing up, activity cooling down, and the charts flashing mixed signals that somehow still lean bullish. DOGE is hovering around $0.1492, barely up on the day, but it has managed to grind out a 2.7% gain on the week. Meanwhile, daily trading volume tanked over 30% to about $779 million, showing just how fast the market cooled off. Even with that slowdown, DOGE keeps drifting higher… which is exactly the kind of quiet climb that gets trader chat buzzing.
DOGE price chart by Trader Tardigrade
Whales Go Silent, but DOGE Still Pushes Higher
Whale activity on the Dogecoin network has dropped to its lowest point in two months, and the charts make it painfully obvious. The large transaction bars that normally spike loud and tall have been thinning out through October and November until they’re basically flat. When whales disappear, momentum usually fades, because these are the wallets that shove price into gear. But here’s the odd part: DOGE is still inching higher. That disconnect has traders wondering whether the whales are simply sitting back, waiting, letting the market build pressure on its own before stepping in later. It doesn’t automatically mean a crash is brewing — but it does paint a picture of hesitation, like the market is catching its breath before deciding what comes next.
A Bullish Pennant on the 4H Chart Has Traders Leaning Bullish
On the 4-hour chart, Trader Tardigrade pointed out a clean bullish pennant forming. And honestly, it’s hard to miss. The price has been compressing neatly between two converging trendlines — pullbacks getting smaller, buyers stepping in each time the lower line is touched. DOGE is now sitting right at the apex, the moment where pennants either break upward with force or fail and drift downward. Patterns like this resolve quickly once they break, so traders are glued to the chart. If DOGE pushes up through the pennant, it wouldn’t be surprising to see a sudden burst of momentum, especially since the market hasn’t had a real volatility spike in days.
A Fake Breakdown on the 3-Day Chart Mirrors Previous DOGE Reversal Patterns
The 3-day chart is where things get really interesting. According to Trader Tardigrade, every time DOGE slips below its long-term support line, the market freaks out briefly and then — almost like clockwork — snaps back into a strong upward move. It’s happened multiple times over the years. DOGE dips, shakes out the weak hands, and then rebounds sharply. The latest move looks almost identical. Price poked below support again, only to curl back up inside the blue demand zone, hinting that momentum may be shifting back in favor of the bulls. These fake-out breakdowns have repeatedly led to big rallies, so traders are watching closely to see if DOGE is about to repeat the pattern.
DOGE price chart by Trader Tardigrade
If the behavior plays out the same way it has before, Dogecoin might be warming up for another meaningful move higher. Nothing’s locked in, but the structure looks familiar — eerily familiar — and the market just needs a bit of volume to confirm it.