
- Dogecoin is testing a long-term trendline after breaking below $0.12
- ETF inflows have stalled completely, leaving DOGE dependent on retail flows
- Persistent spot outflows and weak momentum keep downside risks in focus
Dogecoin is trading around $0.1128 today after slipping below the $0.12 mark and drifting into a test of a long-term trendline that has held since mid-2024. The move feels heavy, not dramatic, just persistent. With ETF demand stalling and spot outflows continuing, DOGE is still missing a clear catalyst to interrupt months of steady selling pressure.
So far, buyers haven’t stepped in with much conviction. Price is hovering, waiting, and the longer it stays here, the more fragile the structure starts to feel.
ETF Demand Never Really Shows Up
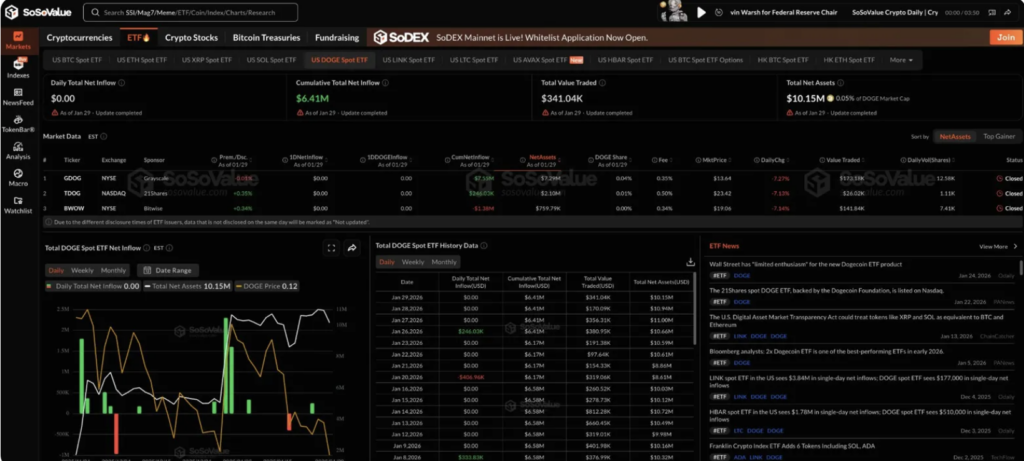
The long-anticipated Dogecoin ETF narrative hasn’t played out the way bulls hoped. Data from SoSoValue shows zero inflows across all three DOGE spot ETFs on January 29, leaving total net assets stuck at roughly $10.15 million. Since launch, cumulative inflows sit at just $6.41 million, a small number by almost any comparison.
Other altcoin ETFs tell a very different story. XRP spot ETFs have pulled in around $1.26 billion, Solana funds roughly $884 million, and even Chainlink ETFs, a much smaller market, have gathered $73 million with assets under management near $86 million. Against that backdrop, DOGE stands out, and not in a good way.
The lack of institutional participation keeps Dogecoin heavily reliant on retail sentiment and spot trading. Without ETF-driven demand, price has little support when selling pressure shows up, and lately, it has.
Spot Outflows Signal Ongoing Distribution
On the spot side, Coinglass data shows net outflows of about $10.88 million on January 30 alone. That continues a broader distribution trend that’s been in place for much of the last two months. Rather than accumulating dips, many holders appear to be trimming exposure, slowly but consistently.
Dogecoin has also lacked a narrative spark. The meme coin rally that carried momentum into late 2024 has faded, and Elon Musk, once a reliable source of sudden volatility, has been notably quiet on DOGE. Without that attention, and without strength across the wider crypto market, sellers have largely dictated the tape.
Long-Term Trendline Test Raises the Stakes
Technically, the picture remains tilted to the downside. On the daily chart, DOGE trades below all major EMAs, with bearish structure intact. The 20-day EMA sits near $0.1268, the 50-day at $0.1347, the 100-day around $0.1498, and the 200-day near $0.1708. The Supertrend indicator also remains bearish, hovering around $0.1344.
Price is now pressing against an ascending trendline drawn from the July 2024 lows near $0.09. This line has held through several pullbacks, acting as a quiet anchor for the broader structure. A clean break below it would mark a shift from consolidation into a more decisive breakdown. Meanwhile, a descending trendline from September 2024 continues to cap rallies, compressing price into a narrowing wedge that’s approaching its resolution point.
Short-Term Momentum Offers Little Relief
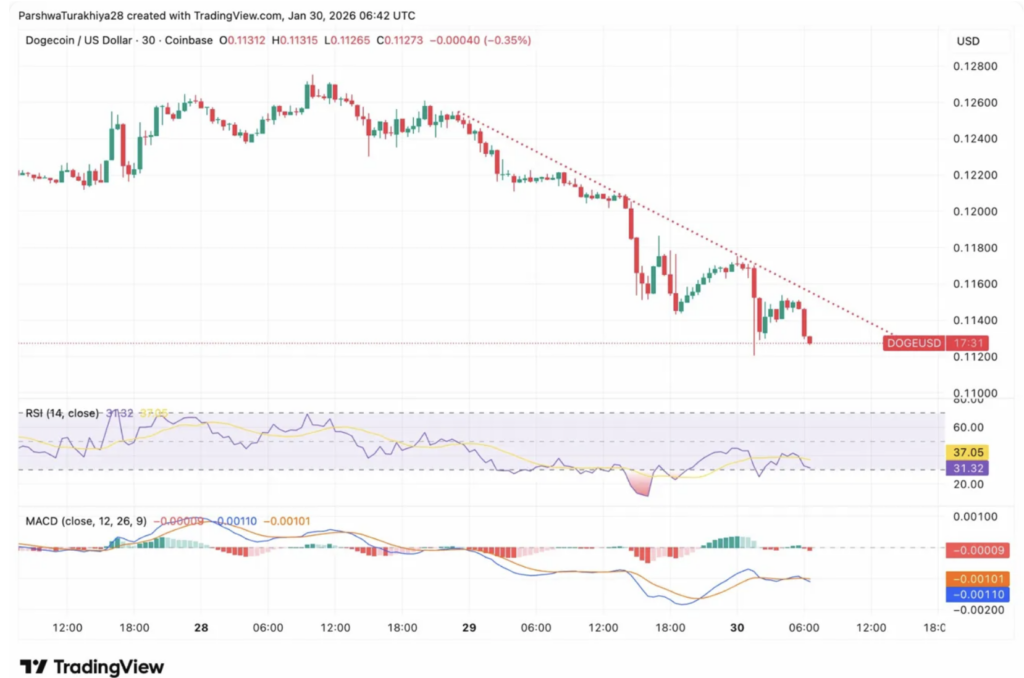
Zooming into intraday action, the weakness is more obvious. On the 30-minute chart, DOGE has printed lower highs since January 28, with each bounce rejected along a descending trendline. The latest push sent price below $0.1130, keeping pressure firmly on the downside.
RSI sits near 31.3, flirting with oversold territory but not quite there yet. MACD remains negative, and the histogram continues to show bearish momentum rather than exhaustion. Immediate resistance rests near $0.1145 along the intraday trendline, while support sits around $0.1120. Below that, the long-term trendline becomes the final line of defense before deeper downside opens up.