
- DOGE is sitting on the lower edge of its monthly Ichimoku cloud, a key long-term support zone around $0.12–$0.14.
- Weekly price action hovers inside a major support band at $0.135–$0.145 while remaining below all major EMAs.
- A squeeze is forming between overhead supply and structural support, setting up a significant move.
Dogecoin is basically sitting right on top of a long-term support band, almost “hugging” the bottom of its monthly Ichimoku cloud — that’s how analyst Cantonese Cat described it in a chart shared on X. The setup looks a little tense, honestly. DOGE is trading around $0.14050 after slipping about 3.8% so far this month, with the candle opening at $0.14599 and swinging between $0.15340 and $0.13177. Tight action, sure, but clearly leaning downward.
A Closer Look at DOGE’s Ichimoku Cloud Structure
The monthly Ichimoku chart uses standard 9-26-52-26 settings, and right now DOGE is sitting way below both major lines. The Tenkan-sen hovers around $0.20092, and the Kijun-sen sits higher up at $0.27491. The projected cloud spans — plotted up at roughly $0.23792 and $0.26674 — form a red Kumo stretching deep into 2026, almost like a long warning banner.
With DOGE stuck near $0.14, price is basically pressed against the lower edge of that projected cloud. That boundary dips into the low-$0.12 to mid-$0.13 region before flattening out, which is exactly the zone Cantonese Cat highlighted. Back in October, the monthly candle wicked down toward the mid-$0.06s but managed to snap back and close above the cloud floor. The current candle is repeating the same dance — dipping just under the boundary but holding slightly above it.
For traders who rely on Ichimoku structure, that lower Kumo edge is usually treated as “last stand” support for a trend that might still be intact. As long as DOGE keeps closing monthly candles above roughly $0.12–$0.14, the chart can still be interpreted as a bottoming phase instead of a full breakdown. If it loses that, though… the tone shifts quickly.
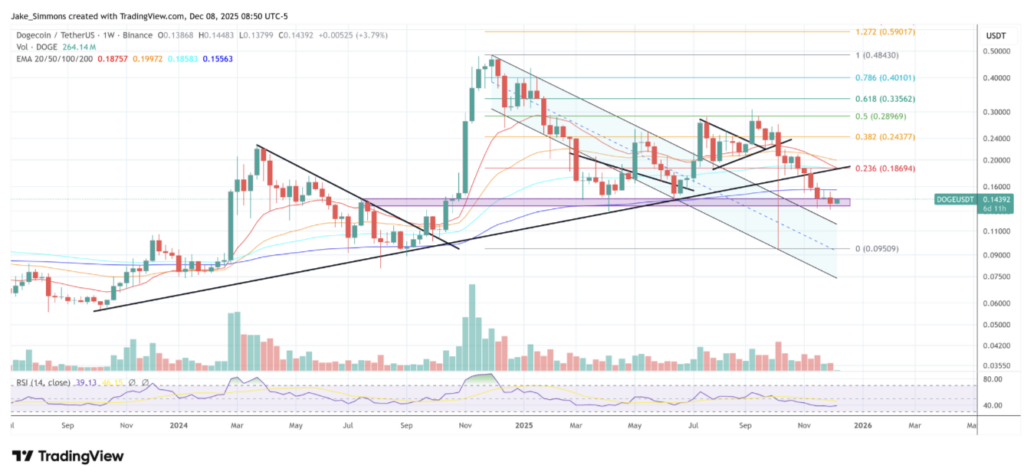
Dogecoin Compresses Inside Weekly Support Zone
Zooming in to the weekly DOGE/USDT chart, price is planted right in a red support band around $0.135–$0.145. It’s the same area where price consolidated during a prior multi-week base and where horizontal resistance capped a breakout before flipping into support.
Over the last several candles, DOGE has been closing right inside this zone while the wicks poke beneath it — almost like the market is trying to test how strong this floor really is. The latest weekly candle trades around $0.14392, keeping DOGE in the upper half of the band but still trapped below the 20-, 50-, 100- and 200-week EMAs. The 200-week EMA sits at $0.15563, basically forming the “ceiling” just above current price.
DOGE also slipped beneath the rising black trendline that had been linking higher lows for months. Breaking beneath that sent price lower fast, and now the intersection of that broken trendline with the stacked EMAs creates a supply zone overhead. Price is getting squeezed between that supply cluster and the horizontal support block — a setup that usually resolves with a meaningful move.
Whether Dogecoin holds the $0.12–$0.14 Ichimoku support could end up deciding the entire next chapter of its long-term structure.