
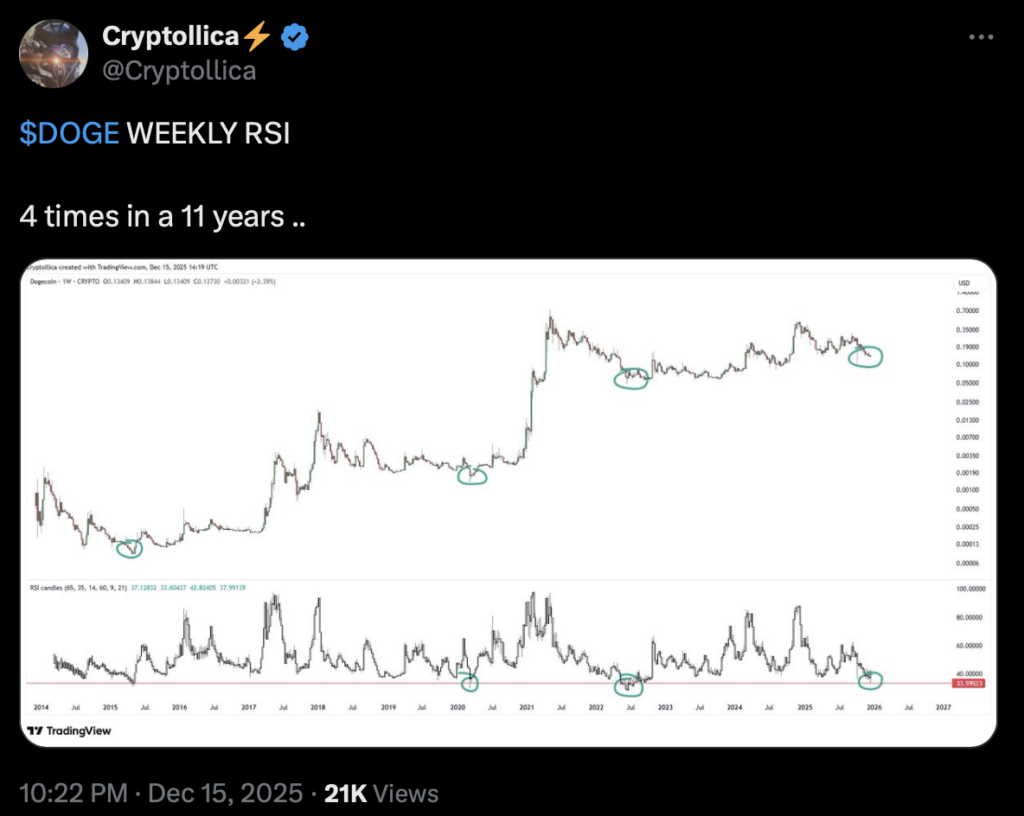
- DOGE’s weekly RSI has dropped into a rare low-30s zone that historically appears during extended selloffs
- Past RSI extremes often aligned with market stress, but recoveries took time and timing varied widely
- This cycle is more derivatives-driven, with weak ETF inflows suggesting speculation is still steering price action
Dogecoin has stayed under steady pressure this week, and the longer-term signals are starting to look uncomfortable. Its weekly Relative Strength Index has slipped into a zone that has shown up only a handful of times across DOGE’s entire trading history. This isn’t a quick intraday wobble either. It’s the kind of signal that usually appears after sustained selling, when the market has already been leaning bearish for a while.
At the time of writing, DOGE was trading around $0.129, down modestly on the day. Price action looks heavy, and the broader tone suggests traders are still cautious rather than eager to step in.
Why the weekly RSI matters more than short-term signals
The RSI measures momentum by comparing recent gains to losses, but the timeframe matters a lot. On a weekly chart, the indicator smooths out noise and reflects deeper market behavior, not just fast money flipping positions.
With DOGE’s weekly RSI hovering near the low-30s, it tells a pretty clear story. Sellers have controlled the tape for weeks, not hours. This is very different from short-term oversold readings that can unwind in a day or two with a quick bounce.
That said, a deeply oversold weekly RSI does not mean price is about to snap back instantly. In past cycles, similar readings often showed up early in stressful periods, with price continuing to drift or base for quite some time before any real recovery took shape.
How DOGE behaved during past RSI extremes
There have only been a few moments when Dogecoin’s weekly RSI dropped this low, and each one came during a broader market shock.
Back in May 2015, DOGE was trading at fractions of a cent, liquidity was thin, and interest in the asset had faded badly. The market stayed quiet for a long stretch before eventually finding life again during the 2017–2018 cycle.
Another appearance came in March 2020, during the global market panic tied to the early COVID crash. DOGE hovered near $0.0015 at the time. The recovery wasn’t immediate, but the following year brought a dramatic repricing as risk appetite returned across crypto.
The most recent example was June 2022, right in the middle of the crypto bear market. DOGE traded around $0.053 before gradually recovering in phases as conditions stabilized and speculative interest crept back in.
In each case, the RSI extreme lined up with heavy downside pressure. What it didn’t do was provide a clean timetable for when price would actually turn.
Why this cycle feels different
This time around, the backdrop has changed. Dogecoin now trades across spot markets, futures, and exchange-traded products, with price action influenced as much by derivatives positioning as by long-term holders.
Recent data shows no fresh inflows into U.S. spot DOGE ETFs, even as futures volume picks up. That split hints that current movement is being driven more by short-term speculation than by patient capital stepping in to accumulate.
Broader crypto sentiment also remains uneven. Some assets are seeing selective interest, while others continue to bleed quietly. In that environment, oversold conditions can stick around longer than many expect.
For DOGE, the weekly RSI flashing near historical lows doesn’t confirm a bottom. What it does show is stress. Real improvement would likely require price stabilization, better volume behavior, and clearer signs that capital is shifting from speculation toward longer-term positioning. Until then, the signal is more of a warning light than a green one.