
- Monthly DOGE cycles often show long consolidations followed by sharp pump phases
- Weekly PMO dropping below a macro threshold has historically appeared near cycle lows
- A breakout remains conditional and would require sustained acceptance above the base ceiling
Dogecoin’s longer-term charts are flashing a pattern that traders have seen before, and it’s the kind of setup that tends to get people paying attention again. A cycle map shared by Trader Tardigrade suggests DOGE often spends long stretches consolidating, then suddenly breaks into sharp “pump” phases once the base is finished. At the same time, Bitcoinsensus pointed to a weekly PMO signal that just dipped below a macro threshold, a move that has historically appeared near major cycle lows.
None of this guarantees an upside breakout is happening tomorrow. But it does suggest Dogecoin might be entering that late-stage compression phase where the market feels dead, boring, and kind of hopeless… right before things start moving again.
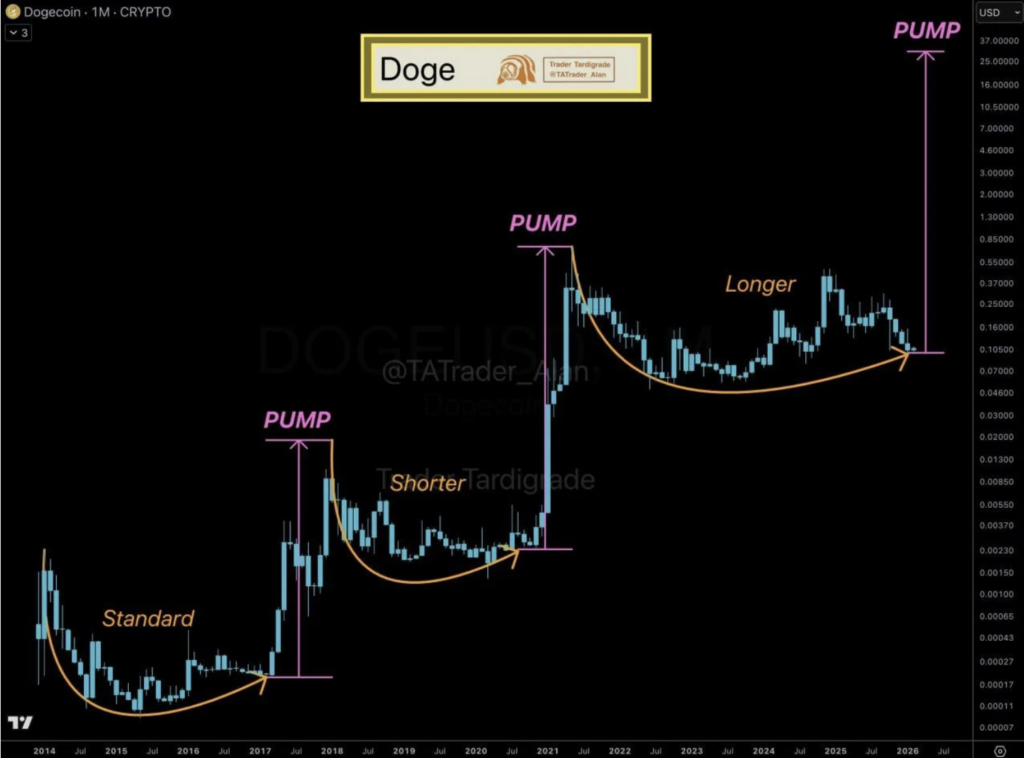
Monthly Dogecoin chart shows pullback, base, then pump pattern
Trader Tardigrade shared a monthly DOGE chart showing what looks like a repeating rhythm going back to 2014. In each completed cycle, Dogecoin first pulls back hard, then grinds sideways into a rounded base, and eventually breaks out into a steep vertical run that the chart labels as a “pump” phase. The consolidation periods aren’t all identical either, and the trader categorizes them as standard, shorter, and longer phases depending on how much time the base took to form.
What stands out is that even though the duration changes, the sequence stays similar. Dogecoin compresses, builds a rounded structure, then expands violently once it clears the ceiling. Earlier cycles showed longer, slower base building. Later cycles formed faster, followed by a sharp vertical move. Different pacing, same general story.
The most recent portion of the chart places DOGE in another rounded base after the prolonged decline from the last cycle peak. Price action has compressed into a narrower range, and higher lows appear to be forming along a rising curve. The projection on the far right suggests a possible expansion leg, but importantly, it frames the current structure as consolidation still in progress, not the pump phase already underway.
Historically, the expansion phase only started once DOGE reclaimed key monthly support zones and pushed above the upper boundary of the rounded base. That breakout usually triggered steep monthly candles and quick separation from the base.
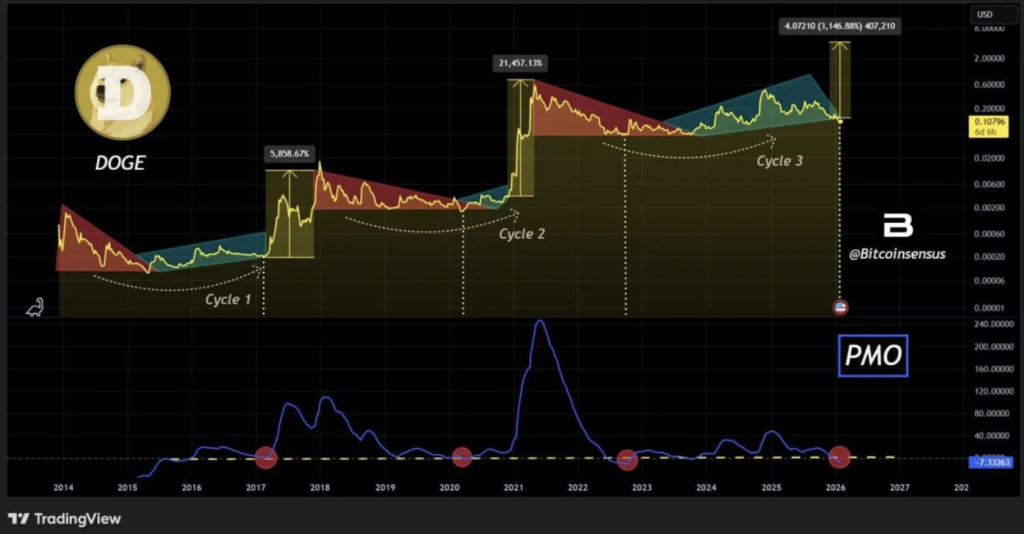
Weekly PMO signal suggests Dogecoin may be near a macro low
A separate chart from Bitcoinsensus focuses on the weekly Price Momentum Oscillator. According to the post, DOGE’s PMO has slipped below a white threshold line that the analyst treats as a macro bottom marker. This same type of downside crossover has appeared near major cycle lows in the past, and in those cases, it tended to show up before DOGE entered a longer recovery phase.
The chart breaks Dogecoin’s history into multiple cycles and matches each cycle low with a similar PMO dip below the reference line. These moments often lined up with periods where price stopped trending lower, then moved into a flatter base before eventually shifting higher. So rather than signaling the start of a new down leg, the indicator is being interpreted as a “late decline” signal, where the worst part may already be behind.
That said, the setup is still conditional. If DOGE breaks down hard and stays weak even after the PMO crossover, it would weaken the historical comparison. Indicators work best when price confirms them, and right now, the market is still in the waiting phase.
Dogecoin may be compressing, but the breakout still needs confirmation
Taken together, these charts paint a similar picture. Dogecoin may be sitting in the later stages of consolidation, with monthly structure showing rounded base behavior and weekly momentum readings hinting at a potential macro bottom. If history repeats, the next steps would likely involve stabilization above the recent base, followed by a trend shift that develops over weeks or months, not overnight.
For now, it’s still a “watch and wait” setup. But it’s the kind of setup that, in past cycles, has been the quiet part right before the market gets loud again.