
- Chainlink has been trending lower, but selling pressure is beginning to slow on the weekly chart.
- A hidden bullish divergence suggests downside momentum is weakening, even if price remains muted.
- Holding recent lows keeps the recovery case intact, while a breakout would require reclaiming resistance.
Chainlink has spent most of the past year drifting lower. Interest cooled, momentum faded, and price followed suit, pushing many traders to look elsewhere. Now though, the weekly chart is starting to hint that something may be changing, not loudly, not dramatically, but just enough to notice if you’re watching closely.
There’s no breakout here. No sudden pump or explosive candle. Instead, LINK appears to be slowing down after months of lower highs and lower lows, pulling price back toward levels last seen before the 2024 run. That kind of deceleration often shows up near turning points, even if price still feels heavy.
A Subtle Signal Appears on the Weekly Chart
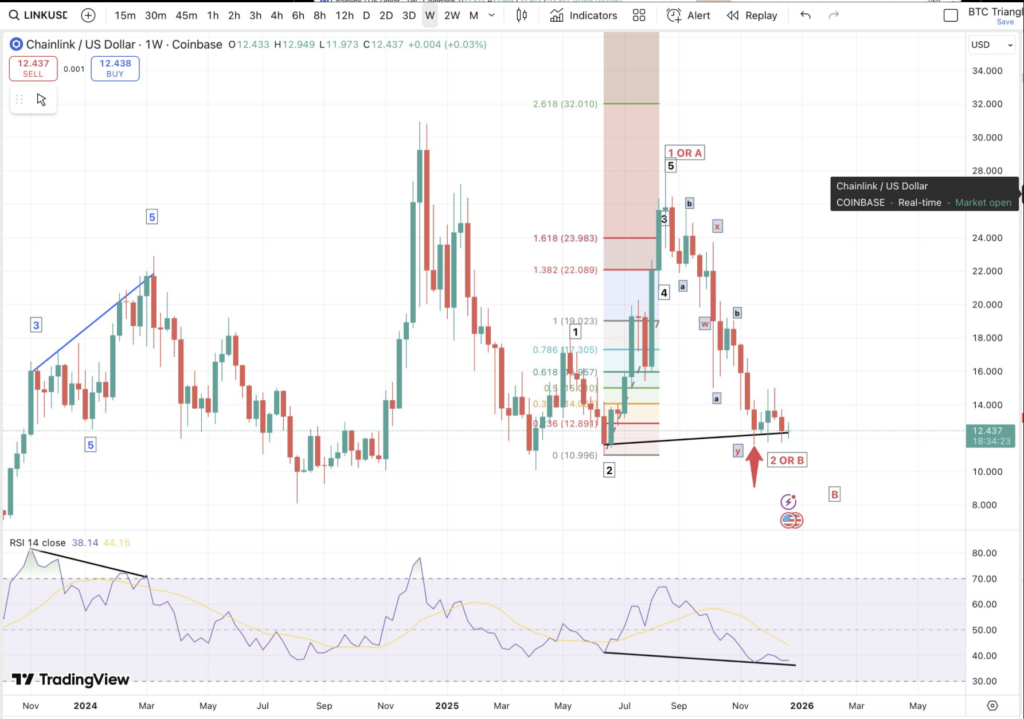
Veteran trader Matthew Dixon recently pointed out that LINK is now flashing a hidden bullish divergence on the weekly timeframe. In simple terms, price has started to form a higher low while momentum indicators like RSI have pushed to lower lows. It’s a quiet signal, but one that matters.
What this tells us is that price is holding up better than momentum would suggest. Selling pressure is still present, but it’s losing strength. Dixon also noted that the last major divergence on LINK was bearish and accurately warned of the decline, which gives this new signal a bit more weight, even if it’s not a guarantee.
Momentum Is Weak, but No Longer Collapsing
Looking closer at the weekly RSI, momentum remains low, yet it’s no longer falling aggressively. Each sell-off has less impact than the last, which is often how exhaustion begins to show. That loss of downside force is the core of this setup, and it’s something that doesn’t usually jump out at first glance.
Volume has also cooled off, fitting the idea that forced selling has mostly passed. LINK is hovering near long-term support zones that have mattered in previous cycles, a place where accumulation has historically started, slowly, quietly, without much excitement at all.
What Needs to Happen Next for LINK
This setup only works if recent lows continue to hold. A clean break below them would weaken the bullish case and suggest that the market isn’t done correcting yet. On the flip side, reclaiming prior resistance zones would be the first real sign that buyers are stepping back in with conviction.
For now, LINK appears to be in a recovery phase, not a breakout phase. The weekly signal forming doesn’t promise fast gains or instant upside, but it does hint that the worst of the decline may already be behind it. These are the kinds of moments that often go unnoticed, right up until price finally starts moving and the quiet phase is over.