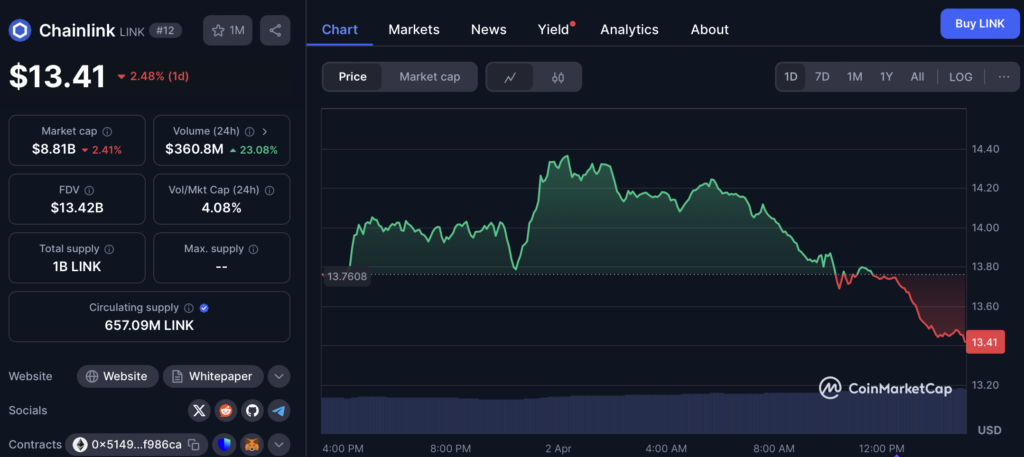
- LINK broke down from its support last week, invalidating a hopeful bullish setup from early March.
- Indicators are mixed, with RSI and MACD showing early strength but failing to confirm a trend reversal.
- Further downside likely, with a potential drop to ~$9.60 in April if bearish patterns play out.
So, here’s the deal: 2025 didn’t exactly roll out the red carpet for Chainlink. The year kicked off rough, but on March 11, things finally started looking up—higher lows, a bit of momentum, even hints of a breakout. Hope flickered.
Then… it all kind of fell apart.
Last week flipped the script. Instead of pushing past resistance, LINK took a nosedive, slipping below its support trend line and shattering that nice bullish setup traders were watching. Now? There’s not much standing between LINK and single-digit territory. All eyes are locked on the chart, waiting to see if it’s gonna break lower in April.
Price Action in a Nutshell
Since December 2024, LINK’s been sliding down inside this descending parallel channel. Not ideal. But earlier in March, just like some folks predicted, it bounced off the channel’s lower boundary (yep, that little green icon on the chart) and tried climbing back up.
Too bad that move didn’t last.

Indicators Say… Meh?
The technical indicators are being a bit confusing right now. The RSI (Relative Strength Index) flashed a bullish divergence before the bounce, which seemed promising. Same with the MACD—it crept up toward zero, hinting at a shift.
But… neither of them followed through.
RSI broke its trendline. MACD didn’t even manage to get above zero. So, honestly, it’s a toss-up—still stuck in the lower half of the channel, and the trend? Not clearly bullish, not totally bearish either. Just kinda… stuck.
Is April Gonna Hurt?
The wave count’s not pulling any punches—it’s leaning bearish. According to that analysis, LINK’s been in a five-wave drop since hitting its cycle high. And that same rejection from last week? It might’ve turned this channel into a descending wedge instead. That’s not great.
Zooming in a bit: Chainlink also cracked below a short-term support line (you’ll see it as a dashed line on the chart). That’s another strike against the bullish setup.
Also, that whole bounce earlier? Looks like an A-B-C correction—classic pattern before another drop. So yeah, not ideal.
What’s Next?
If this wedge pattern plays out, LINK might dip again soon—possibly down to around $9.60. That’s where the wedge’s support line is hanging out. After that, maybe a rebound? But first, the fall.
TL;DR – Not Looking Good (For Now)
Chainlink’s still stuck in a downtrend since its December high. The March bounce gave some false hope, but the bullish vibes didn’t stick. If current patterns hold, LINK could see more pain in April, sliding down to that $9.60 mark before—maybe—finding some footing.
But hey, it’s crypto. Things change fast.


