
- LINK price is slipping even as trading volume spikes, hinting at distribution
- Bearish head-and-shoulders structure puts focus on the $10–$11 support range
- Stronger fundamentals and new data streams continue to support long-term adoption
Chainlink (LINK) was trading near $11.84 on Tuesday, down about 1.8% over the past 24 hours, as traders balanced rising activity against growing technical risk. What stood out wasn’t the price move itself, but the volume. LINK’s 24-hour trading volume surged nearly 154% to roughly $495 million, pointing to heightened volatility even as price action stayed relatively muted.
On a weekly basis, LINK is down close to 7%, with the seven-day average hovering around $11.86. This divergence, rising volume alongside a slipping price, often hints at distribution rather than accumulation. Traders appear to be repositioning around a key support zone that could end up deciding where LINK heads next, at least in the near term.
Chainlink rebounds continue to lose strength
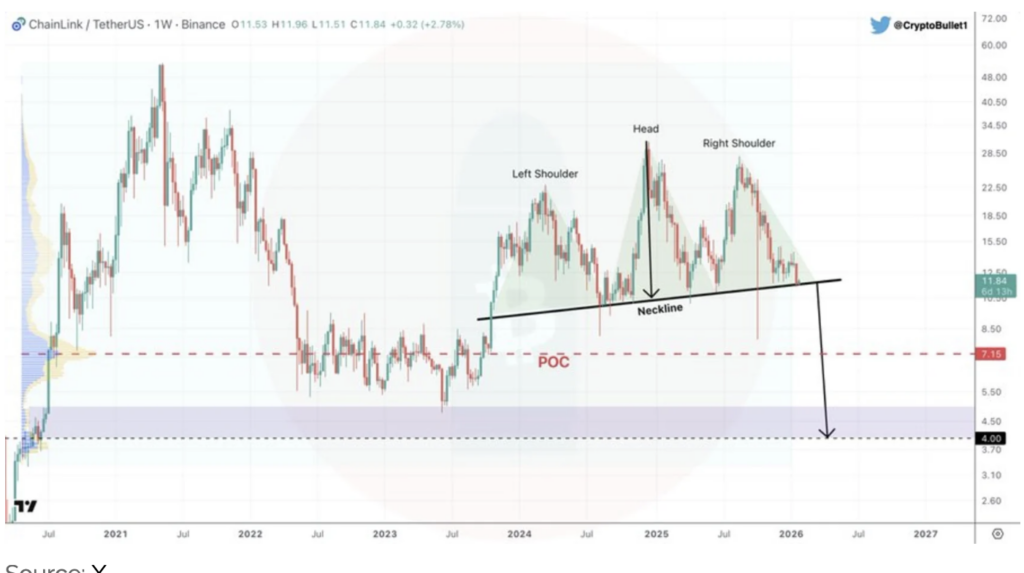
In a recent post on X, crypto analyst CryptoBullet pointed out that LINK’s weekly chart is forming a large head-and-shoulders pattern. This structure is typically considered bearish, often showing up near the end of longer uptrends. In this case, it reflects fading buyer momentum after Chainlink’s strong run through 2023 and into early 2024.
Each rebound attempt has stalled below the previous high, a classic sign that upside pressure is weakening. The neckline of the pattern sits between roughly $10 and $11 and slopes slightly upward, which can be misleading for bullish traders watching shorter timeframes. According to CryptoBullet, a confirmed weekly close below this zone could expose LINK to a drop toward $7.15, an area that saw heavy trading during the 2022–2023 accumulation phase.
In a more aggressive downside scenario, the full measured move of the pattern projects toward the $4 to $5 range. That zone lines up with historical demand, but it’s worth stressing these are technical projections, not certainties. Markets rarely move in straight lines, especially when sentiment is mixed.
Fundamentals strengthen even as charts weaken
While the technical picture looks pressured, Chainlink’s fundamentals have continued to improve. The recent launch of its 24/5 U.S. Equities Data Streams marks a notable upgrade, allowing near-continuous onchain access to U.S. equities and ETF data. This move targets an estimated $80 trillion traditional market and expands Chainlink’s reach across DeFi sectors like derivatives, lending, and prediction markets.
Johann Eid, Chief Business Officer at Chainlink Labs, described the rollout as a step toward always-on, cross-border capital markets. Early integrations from industry players such as Lighter and BitMEX suggest the demand is real, not just theoretical. These data streams give protocols more reliable inputs, which tends to matter more over time than short-term price swings.
Chainlink has already facilitated more than $27 trillion in onchain transaction value, and it continues to position itself as core infrastructure connecting traditional finance with blockchain systems. For LINK, that creates an interesting tension. Technicals warn of downside risk, while fundamentals quietly keep stacking. Which side wins out may depend on how price behaves around that $10 to $11 support zone.