
- Cardano (ADA) is struggling below key resistance at $0.60, with mixed momentum signals and bearish pressure still dominant on higher timeframes.
- If ADA fails to reclaim $0.60–$0.6240, support levels at $0.5680, $0.5550, and $0.50 are at risk; a deeper drop could send it toward $0.42–$0.37.
- Upside potential exists if ADA breaks above $0.6320, possibly targeting $0.68–$0.70, but for now, any bounce looks corrective — not the start of a new uptrend.
Cardano (ADA) hasn’t had the easiest ride lately. After slipping under a bunch of key support levels, the token’s been trying to claw its way back — but so far, the recovery hasn’t exactly been convincing.
Let’s break it down.
ADA Finds a Floor (Kind Of)
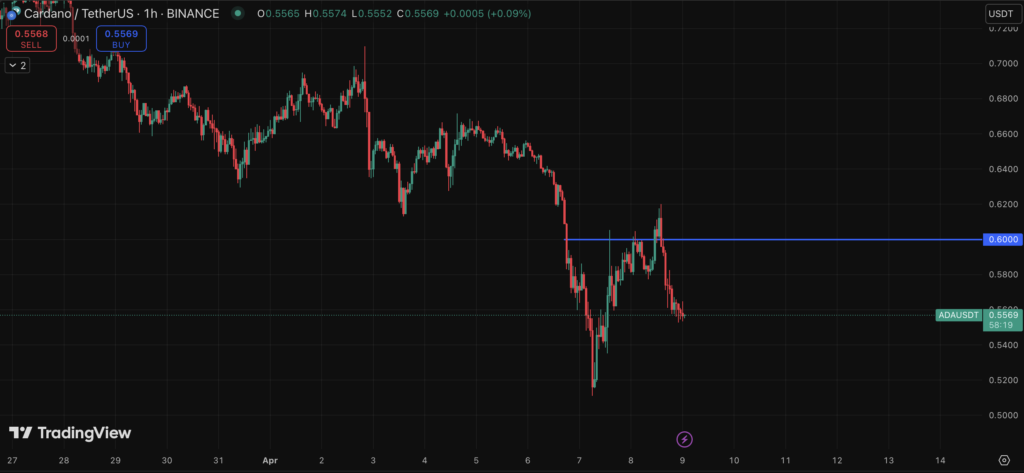
After tumbling down to around $0.5106, Cardano did manage to bounce. That small rebound pushed it back above the $0.540 and $0.5550 marks — and even past the 50% Fibonacci retracement level (from the swing high at $0.6712).
Sounds good on paper, but zoom out a bit, and you’ll see ADA is still stuck under $0.620, not to mention it’s trading below the 100-hour simple moving average.
There’s also a stubborn bearish trendline forming resistance right around $0.60. It’s been acting like a ceiling every time the bulls try to break higher.
What the Charts Are Saying
Right now, the technical setup feels… stuck. On one hand, the hourly RSI is sitting above 50, which suggests there’s a bit of life in the bulls. But the MACD is still flashing red in the background, showing lingering bearish momentum.
And when you look at the bigger picture — specifically the 4-hour chart — it’s clear ADA isn’t in great shape. It’s trading below all major EMAs (20, 50, 100, and 200). That’s a red flag for anyone hoping the trend is turning up.
Resistance-wise, ADA’s got a wall at $0.60, and even if it clears that, $0.610 (also the 61.8% Fib level) is waiting up ahead. The real test? Breaking above $0.6320. If that happens, a run toward $0.68 or even $0.70 could come into play — but it’s a big “if.”
Support Levels to Watch Closely
If Cardano fails to push past $0.60 again, expect another leg down.
The first safety net is around $0.5680, then $0.5550. Break those, and we’re looking at a possible dip to $0.5320.
But the real danger zone? That would be $0.50 — a psychological support that might attract buyers… or collapse under enough pressure.
A sustained breakdown could drag ADA down toward the $0.42–$0.44 demand zone, an area last touched in October 2023. Worst-case scenario? Bears target the $0.37 level, which lines up with a bearish flag target and the 1.618 Fibonacci extension.
Also worth noting: ADA’s rising wedge pattern has now fully broken down, and it’s trading well below its multi-month ascending trendline. It also failed to hold the 23.6% Fib level at $0.7152, which throws cold water on any hopes of a stronger retracement — at least for now.
So… What’s the Move?
Unless ADA reclaims $0.6240 with solid volume and technical confirmation, any bounce here is likely just that — a bounce, not a new rally.
Right now, the whole structure looks bearish across the board — trend, momentum, and volatility all say the same thing: sellers still have the upper hand.
Short term? All eyes are on that $0.60 resistance. Break it, and the mood could shift. But fail again, and we might be heading for another round of tests on lower support.