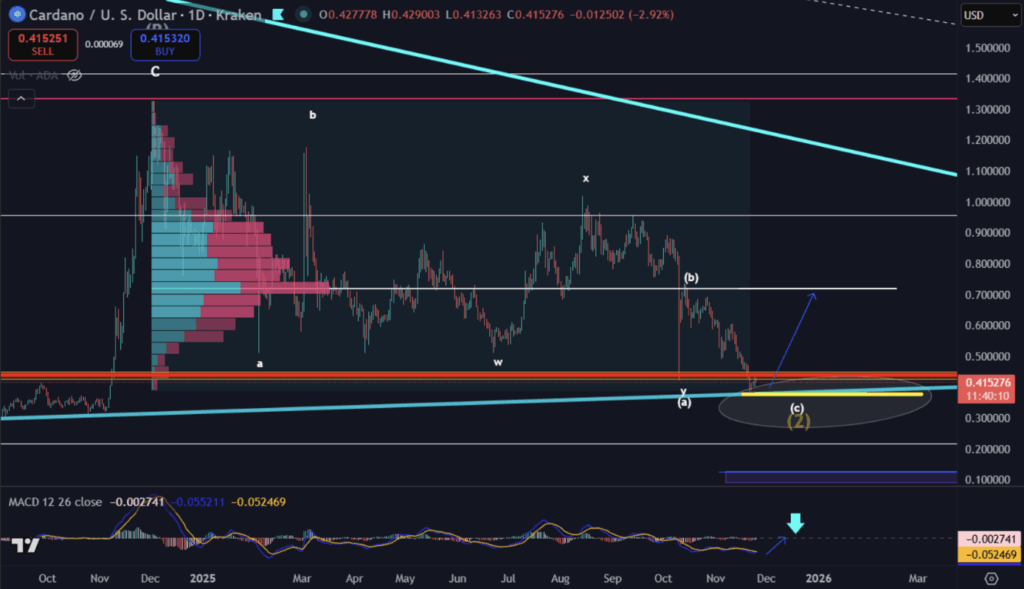
- ADA trades around $0.41 and remains below major EMAs, signaling strong bearish momentum.
- Key supports sit at $0.33, $0.28, and $0.20, while resistance remains heavy near $0.70–$0.75.
- A reversal may form only if ADA reclaims the mid-$0.60s and closes above the 20-week EMA.
Cardano continues fighting heavy bearish pressure as ADA trades near $0.41 — sitting way below the 20-, 50-, 100-, and 200-week EMAs. The weekly chart shows that ADA couldn’t keep the mid-2024 recovery alive, dropping back into the same corrective structure that’s lingered since its post-2021 peak. Recent price candles sliced beneath a cluster of EMAs and even the middle Bollinger Band, hinting that sellers have tightened their grip again. Right now the lower Bollinger Band is practically hugging the price, suggesting compressed volatility and oversold vibes, although a real reversal still hasn’t appeared yet.
Momentum signals remain weak as sellers stay in control
Momentum indicators don’t paint a pretty picture either. The 14-day RSI is sitting near 34 — not quite extreme oversold, but deep in negative territory. There’s no bullish divergence forming, which means sellers still hold most of the momentum. The weekly MACD is also firmly bearish: the MACD line sits below the signal line, and those red histogram bars keep printing, showing continued downward pressure with no real sign of relief. It’s one of those charts where everything leans the same direction… and not the direction bulls want.
Key supports, Fibonacci levels, and the danger zones below
If this bearish mood keeps rolling, ADA could slip further. Based on the Auto-Fibonacci structure from the previous chart, major support zones sit at $0.33 and $0.28, with the 1.618 extension down around $0.20. Historically, these levels have been accumulation zones — places where traders watch closely for even the smallest hint of a reversal spark. On the upside, resistance between $0.70 and $0.75 lines up with the upper Bollinger Band and several long-term EMAs, creating heavy overhead pressure anytime ADA tries to bounce. With the Bollinger Bands compressing and price stuck near the lower boundary, this whole range looks more like a build-up phase than a breakout attempt. But for anything meaningful to shift, weekly closes above the 20-week EMA need to happen… and momentum has to improve, not just stabilize.
A possible catalyst emerges — if ADA clears key levels
Some analysts are watching early December for a potential bullish trigger. Mr. Brownstone noted on X that ADA’s largest weekly trading volume range in 2025 sits around $0.72 — a spot that could become important if price ever pushes up again. There’s also the Midnight event scheduled for December 8, which could stir attention back toward Cardano’s ecosystem. If ADA manages to break above the 20-week EMA in the mid-$0.60s, it might finally halt the bearish trend and start shaping a recovery structure instead of another grind downward. But for now, ADA is still facing strong selling pressure and momentum indicators lean toward either sideways drifting or more decline. Anyone thinking about long positions would need to wait for a proper bullish engulfing candle on the weekly chart — something that shows buyers stepping back in with actual strength. Here is where patience matters, even if sentiment feels exhausted.