
- Hoskinson believes ADA could 100x—and maybe serve as Bitcoin’s DeFi backbone (ambitious!).
- Derivatives data shows reduced open interest and rising short positions, signaling fading bullish sentiment.
- ADA looks technically set for a drop to its 50-day EMA unless bulls show up fast.
Cardano (ADA) isn’t having the smoothest week. It dropped another 1% on Tuesday, extending Monday’s 5% decline. Despite the dip, co-founder Charles Hoskinson jumped on a podcast and dropped a pretty bold take—he thinks Cardano could outperform Bitcoin… and maybe even become its yield layer. That’s… a lot.
On the charts though, it’s not looking too pretty. Technicals and derivatives suggest ADA might be headed for a bigger pullback, maybe down to its 50-day EMA.
Hoskinson Sees Big Things Ahead for ADA—Like Really Big
In a recent chat with Jason Yanowitz over at Blockworks, Charles got real ambitious. He said Bitcoin might hit $1 million someday, which is a solid 10x from here. But Cardano? He’s calling a 100x… maybe even a 1000x. Yes, you read that right.
If those numbers played out, Bitcoin’s market cap would be sittin’ at $23 trillion, while Cardano would be somewhere between $2.7 trillion and $27 trillion. The upper range seems, uh, a bit out there—especially since institutions are all over Bitcoin lately. But hey, dreams fuel crypto, right?
Charles also dropped the idea of Cardano acting as Bitcoin’s yield layer—basically letting BTC holders tap into staking, yield farming, and all the good DeFi stuff through Cardano. He mentioned airdrops too. Like, ADA holders might get annual ones from partner chains. First up? Midnight (NIGHT) tokens. And guess what? Half of those tokens (12B) are earmarked for ADA holders.

ADA Derivatives Cooling Off—OI and Longs Fade
Meanwhile, CoinGlass data shows ADA open interest (OI) slipping from $1.74B to $1.51B. That’s a chunky $230M exit in just a week. Not great. Traders seem to be backing off, and the long/short ratio just dropped from 0.9272 to 0.8864.
More traders are betting against ADA too—short positions climbed to 53.01%, up from 51.89%. The bullish energy’s clearly fading a bit, especially with the broader market feeling wobbly.
Heading Toward the 50-Day EMA?
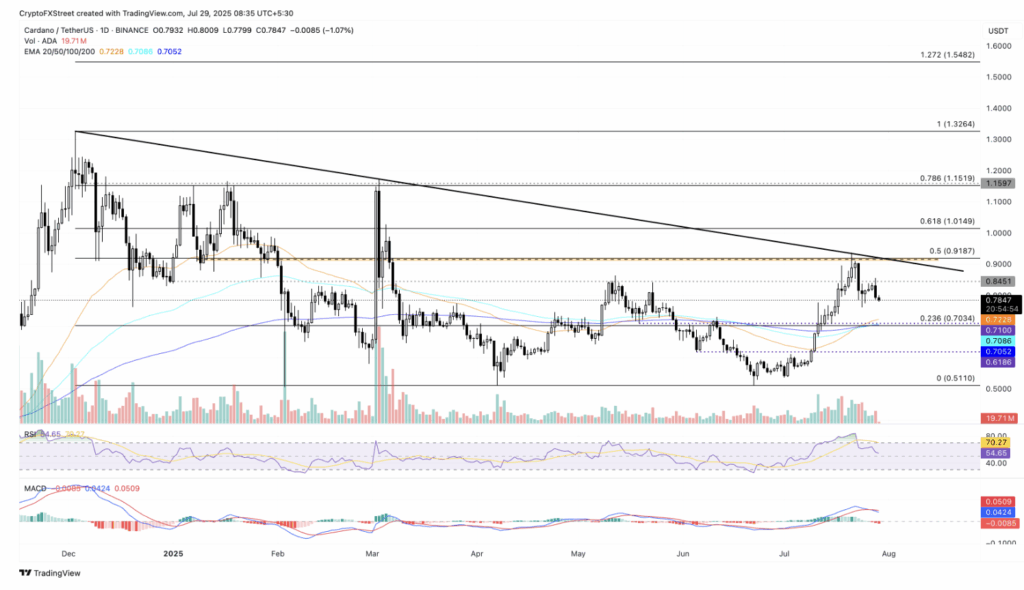
So here’s where the charts come in. ADA just bounced off a multi-month resistance trendline (yeah, the one connecting those December and March highs). It also failed to break above the 50% Fib level at $0.9187.
Now? The path of least resistance seems to be pointing toward that 50-day EMA, currently around $0.7228. The MACD just flipped bearish too, with red histogram bars popping back up. RSI sits at 54, leaning toward neutral but trending downward—less buying, more waiting.
That said, if momentum shifts, ADA could turn back and try to break above that resistance again at $0.9187. But right now, odds are leaning toward another short-term dip.