
- ADA has erased its 2024 election rally and is back at the $0.32–$0.36 support zone.
- RSI divergence and a MACD cross hint that downside momentum may be fading.
- Holding support keeps a move toward $0.42 and $0.50 alive, while a breakdown risks $0.24.
Cardano has come full circle. Within a year, ADA has wiped out the entire 300% rally it posted during the 2024 U.S. election surge, dragged lower by the late-2025 market selloff. Price has now settled back into the $0.32–$0.36 support zone, the same area that launched the explosive move last year, which naturally raises a familiar question, can it happen again?
This level isn’t just psychological, it’s structural. It’s where buyers previously stepped in with conviction, and it’s now being tested under very different market conditions. Whether bulls can repeat history, even partially, will depend on how ADA behaves here, not what it did before.
Momentum Indicators Hint at a Potential Bottom
Since mid-December, ADA has shown subtle but notable signs of resilience. While price printed lower lows through November and December, the daily RSI quietly moved higher, forming a bullish divergence. That divergence suggests selling pressure has weakened, even if price hasn’t fully responded yet.
Momentum indicators added to that picture. ADA recently flashed a MACD golden cross, which lined up with a post-Christmas bounce of around 10%. The token climbed from roughly $0.34 to $0.37, a modest move, but one that matters given the broader weakness. If this support holds, that upswing could stretch further.
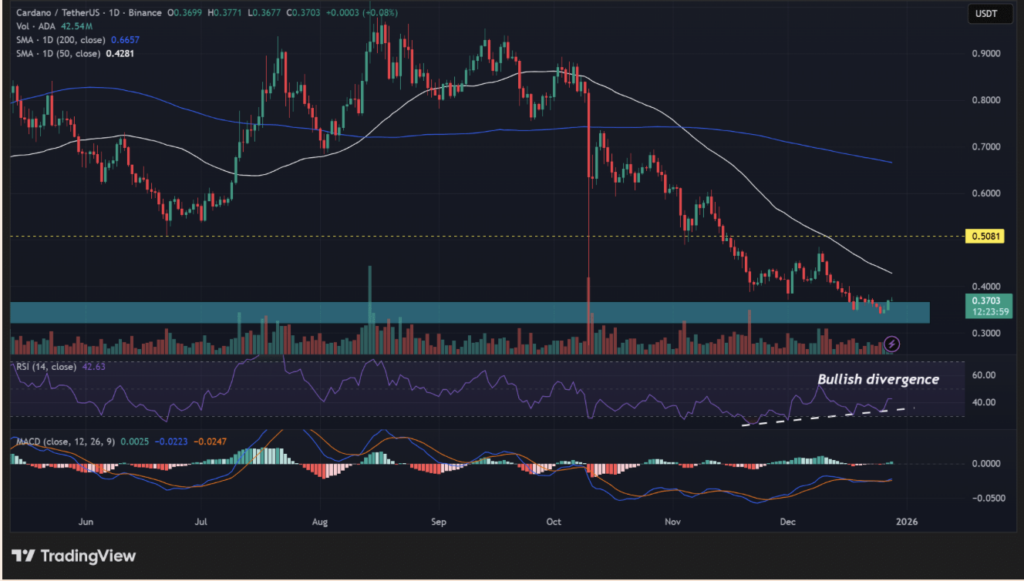
Bulls Face a Clear Technical Test
For now, the recovery thesis hinges on one level. ADA needs to reclaim its 50-day moving average near $0.42. Until that happens, rallies remain corrective, not trend-changing. A clean break and hold above that average would shift momentum more decisively and put the former 2025 support near $0.50 back into focus.
Liquidity data supports that roadmap. The one-month liquidation heatmap shows upside liquidity pools clustered around $0.39 and $0.42, lining up neatly with the 50-day MA. On the downside, leveraged longs sit near $0.34, reinforcing that zone as a short-term magnet if price slips.
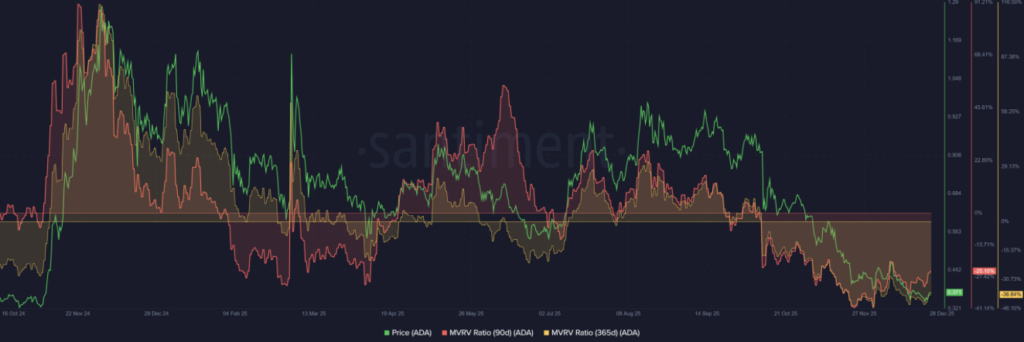
Holder Losses Reduce Sell Pressure
From a longer-term perspective, on-chain data paints a different kind of picture. MVRV ratios show that both short- and long-term holders are underwater. Three-month holders are down roughly 25%, while those holding ADA for over a year face unrealized losses near 38%.
In simple terms, many holders are already hurting. That tends to reduce sell pressure at current levels, since traders are less eager to exit deep in the red. Instead, they often wait for a bounce toward breakeven, which can quietly support price and create opportunity for accumulation.
Risk Still Lurks Below Support
That said, this setup isn’t bulletproof. If ADA breaks decisively below the $0.32–$0.36 support zone, the recovery narrative falls apart quickly. In that scenario, price could revisit the 2023 lows near $0.24, resetting expectations entirely.
For now, ADA sits at a familiar crossroads. The indicators lean cautiously constructive, holder pain limits selling, and history adds intrigue. But support must hold, otherwise the market won’t hesitate to push lower again.