- Cardano has failed multiple times to break the $0.926 resistance since August.
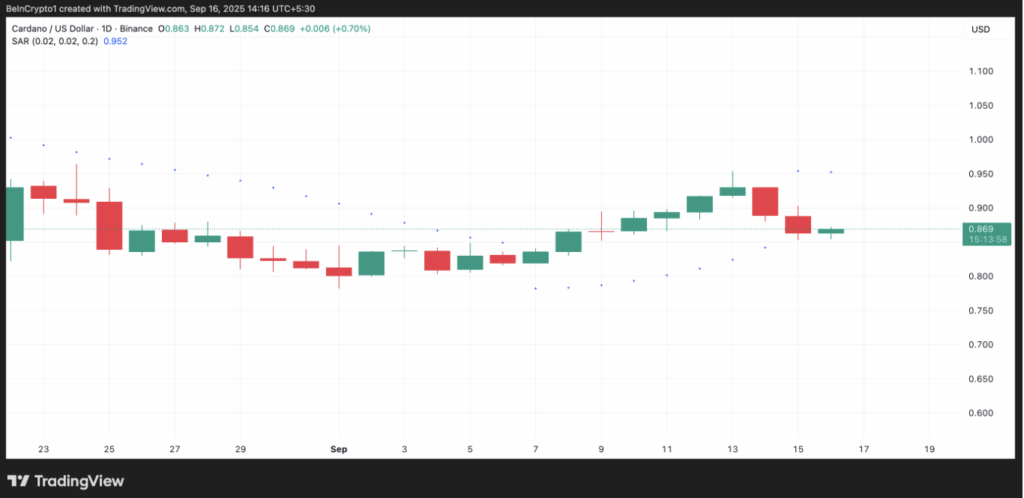
- MACD and Parabolic SAR are flashing bearish signals, pointing to weaker momentum.
- Key levels to watch: downside risk at $0.802–$0.677, upside potential toward $1.079 if bulls reclaim control.
Cardano (ADA) just can’t seem to catch a break above the $0.926 mark. Since mid-August, every push toward that level has been slapped back by heavy selling. The latest setback came on September 14, when ADA touched resistance again but lost momentum quickly, dropping more than 5% since then. Sellers still appear to have the upper hand here, and it’s making the bulls nervous.
Technical Indicators Flip Bearish
Looking at the daily chart, ADA’s indicators don’t look too friendly right now. The Moving Average Convergence Divergence (MACD) is showing early signs of a bearish crossover — with the MACD line on the verge of slipping below the signal line. That’s typically a warning sign that momentum is weakening and deeper losses could be in play if sellers keep pushing.
The Parabolic SAR has also flipped bearish. Its dots are now sitting above price levels, acting like a layer of dynamic resistance. Right now, the SAR is set at $0.952 while ADA trades around $0.869, which makes it even tougher for bulls to flip sentiment in their favor. When SAR dots hover above, it’s usually a sign that bears are in control, and attempts at recovery often fizzle out.
Price Levels to Watch Next
The big question now is where ADA goes from here. If the pressure continues, the coin could tumble toward $0.802. Failure to hold there might drag it further down to $0.677, a level that could really test buyers’ conviction.
On the flip side, if bulls somehow regroup and ADA manages to retest and finally break through the $0.926 ceiling, then things could flip bullish again. That breakout might open the door for a run toward $1.079 — a level not seen since March, and one that could reignite optimism across the Cardano community.