
- ADA is testing a critical $0.30–$0.35 demand zone heading into the monthly close
- A loss of support could open the door to a deeper move toward $0.282
- Weak ADA/BTC structure suggests rallies may stay corrective unless relative strength improves
As the crypto market moves closer to the monthly close, the tone has quietly shifted. Bears are starting to lean in, with Bitcoin slipping below $89,000 and Ethereum hovering uncomfortably close to the $3,000 psychological mark. Cardano isn’t escaping the pressure either, as ADA trades near $0.35 after a sharp retreat from its 2025 highs, a level that’s starting to feel a bit tense.
At the same time, ADA’s performance against Bitcoin continues to look soft. The ADA/BTC pair remains stuck in a long-term downtrend, which takes some of the shine off any short-term USD bounce. The key question now is whether ADA can hold the $0.30 to $0.35 demand zone, an area that has sparked rebounds before, or whether sellers push it lower toward $0.28, where confidence could really start to crack.
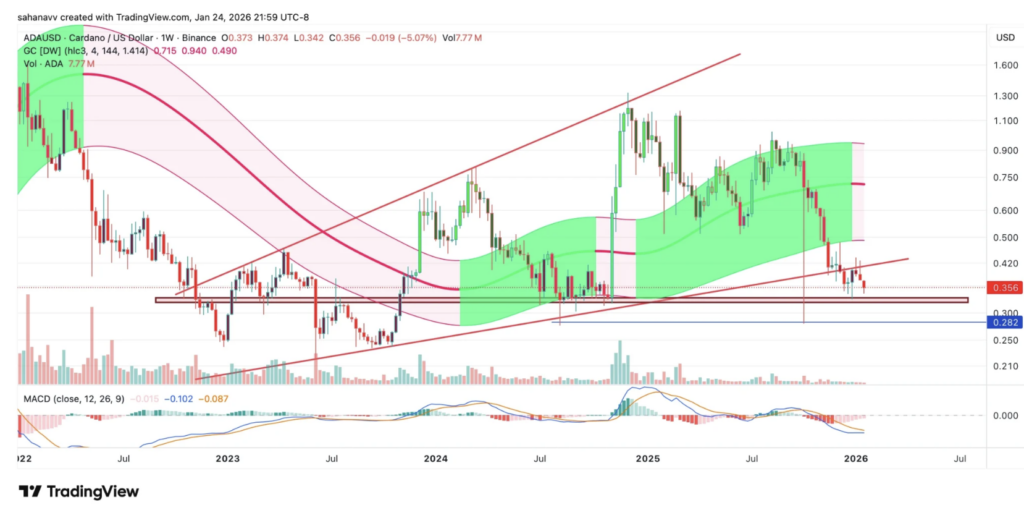
ADA Price Enters a Decisive Phase
Cardano is trading around $0.356 on the weekly chart, following a steady slide down from its 2025 peak. Price is now pressing into a familiar demand band between $0.30 and $0.35, a zone that previously acted as a base when sentiment turned shaky. This area matters heading into the monthly close, because holding it could calm the market and invite some cautious dip-buying, while losing it would hint that buyers are stepping back. Momentum has cooled off, though the structure hasn’t fully broken just yet.
From a technical view, ADA has drifted below its mid-range and the broader trend corridor is starting to weaken. The $0.30–$0.35 band remains the first real cushion, while the next notable downside level sits near $0.282. On the upside, reclaiming $0.42 would help reduce breakdown risk and reopen the path toward $0.50. For now, the MACD stays negative, which quietly suggests sellers still have the upper hand, at least for the moment.
Cardano Relative Strength Against Bitcoin Is Still Weak
The ADA/BTC chart explains why ADA’s moves can feel underwhelming, even when the dollar price looks stable. On the weekly timeframe, the pair is hovering near 0.0000040 BTC, still confined within a long, descending channel that’s been in place since the 2021 peak. This relative weakness matters into the monthly close, as it shows whether capital is actually rotating into ADA or sticking with Bitcoin. Without a shift here, USD rallies may struggle to last.
The structure shows a clean series of lower highs, keeping ADA’s relative strength capped. The current level near 0.0000040 BTC sits close to a key base, so buyers appear to be trying to defend it, though not aggressively. A breakdown below this zone would extend the bearish structure and signal continued underperformance versus Bitcoin. For the narrative to change, ADA/BTC would need to reclaim the channel midline first, then push toward the upper boundary. Until that happens, most bounces still look corrective, not trend-defining.
What’s Next for Cardano (ADA) Price?
ADA’s next move really comes down to how it behaves into the monthly close, right as it sits on a high-stakes support area. On the USD chart, price is leaning on the $0.30–$0.35 band, with $0.356 acting as the current pivot. If buyers manage to defend this zone and push ADA back above $0.42, the market could start to price in a steadier recovery toward $0.50, slowly at first. If that base gives way, especially below $0.282, the chart shifts from a healthy pullback to something more concerning.
The bigger signal, though, remains the ADA/BTC pair. As long as ADA stays trapped in a long-term downtrend near 0.0000040 BTC, it’s hard to argue that the asset is truly regaining strength. For bulls, a sustainable rally likely needs improving relative performance, not just a brief USD bounce. Until then, expect choppy price action around support, with the monthly close acting as the clearest tell of whether ADA stabilizes, or slips further, into February.