
- Cardano flashed a weekly TD Sequential buy signal after months of downside
- $0.37 is the key support that must hold for the setup to remain valid
- A hold could open a move toward $0.54, while a breakdown risks more downside
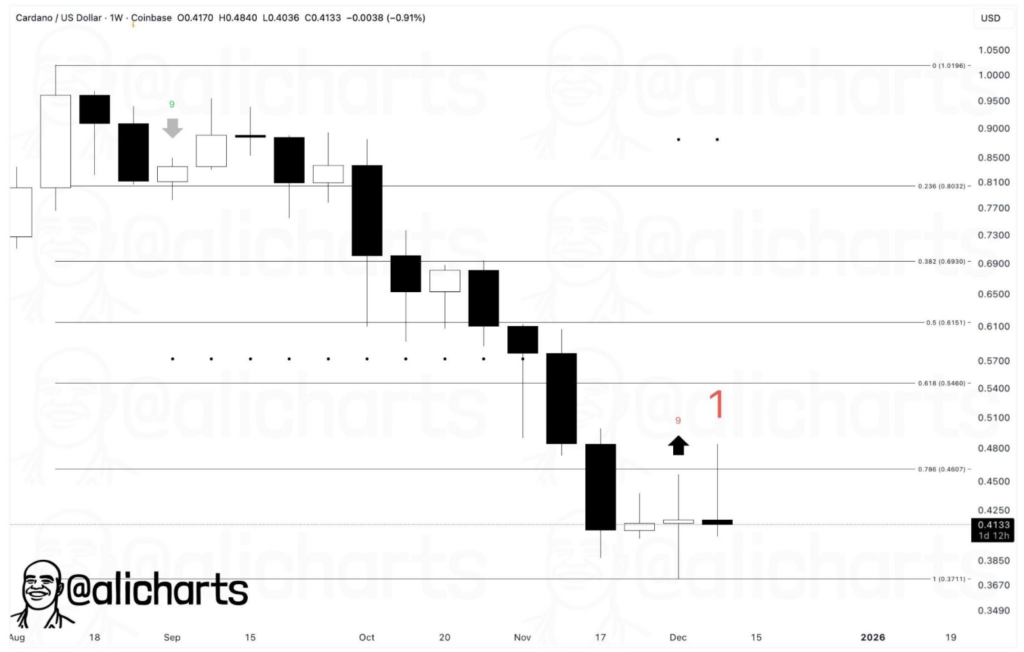
Cardano is quietly finding its way back onto traders’ screens after analyst Ali Martinez flagged a fresh TD Sequential buy signal on the weekly chart. This comes after months of steady downside that dragged ADA from above $0.90 down into the $0.37–$0.41 zone. According to Ali, the signal suggests selling pressure may finally be easing, but there’s a catch, and it’s a big one.
The setup only holds if ADA stays above $0.37. Lose that level, and the signal quickly loses its meaning. The TD Sequential is typically used to spot moments when trends start to run out of steam, especially on higher timeframes, and seeing it appear after such a prolonged selloff is at least worth paying attention to.
Why $0.37 Matters More Than Anything Right Now
On the chart shared by Ali, the $0.37 level stands out immediately. It lines up with a key Fibonacci support zone and has already acted as a floor where buyers stepped in before. Recent candles show long lower wicks and smaller bodies, which usually hints that demand is beginning to absorb supply, slowly but surely.
As long as ADA holds above this area, the structure remains constructive. In that case, the next major level to watch sits near $0.54, which aligns with the 0.618 Fibonacci retracement of the larger move down. That zone was important earlier in the year, and if price returns there, it likely won’t be an easy pass.
If $0.37 fails, though, the tone shifts fast. A breakdown would probably send ADA back into the mid-$0.30s, where the next meaningful support area waits. That would delay any recovery talk and reopen downside risk.
The Weekly Trend Still Has Work to Do
Zooming out, Cardano isn’t magically out of the woods. The broader weekly trend is still bearish, with lower highs and lower lows firmly intact. This is not a confirmed trend reversal, at least not yet.
That said, momentum indicators are resetting and volatility has tightened noticeably. Those conditions often show up near decision points, when the market is figuring out its next move. Ali’s view remains cautious but clear, the buy signal opens the door, but confirmation only comes if buyers defend support and start building higher weekly closes.
What This Means for ADA From Here
Right now, ADA is sitting at a crossroads. Holding above $0.37 keeps the bullish scenario alive and puts $0.54 back into focus. Slipping below that support would invalidate the setup and likely lead to more downside before any real recovery attempt shows up.
ADA isn’t screaming reversal just yet, but the chart does suggest the worst of the selling pressure may be behind it. From here, patience matters more than predictions. The next few weekly closes will likely decide whether this signal turns into something meaningful or quietly fades away.