Bitcoin (BTC) staged a surprise recovery at the start of the year leading to a marked-wide price increase. The uptick has since been painting different bullish setups as investors hope the big crypto will again lead other digital assets in a bull run in 2023.
At the time of writing, Bitcoin was trading at $24,085, down 0.5% in the last 24 hours. The King crypto was up 13% over the previous week and more than 18% over the last 30 days. With its 24-hour trading volume of $29.18 billion, Bitcoin maintained its position as the most prominent cryptocurrency with a market capitalization of $477.46 billion. BTC’s dominance stood at 42.63%, according to data from CoinMarketCap.
Bitcoin Surpasses Visa in Terms of Market Cap
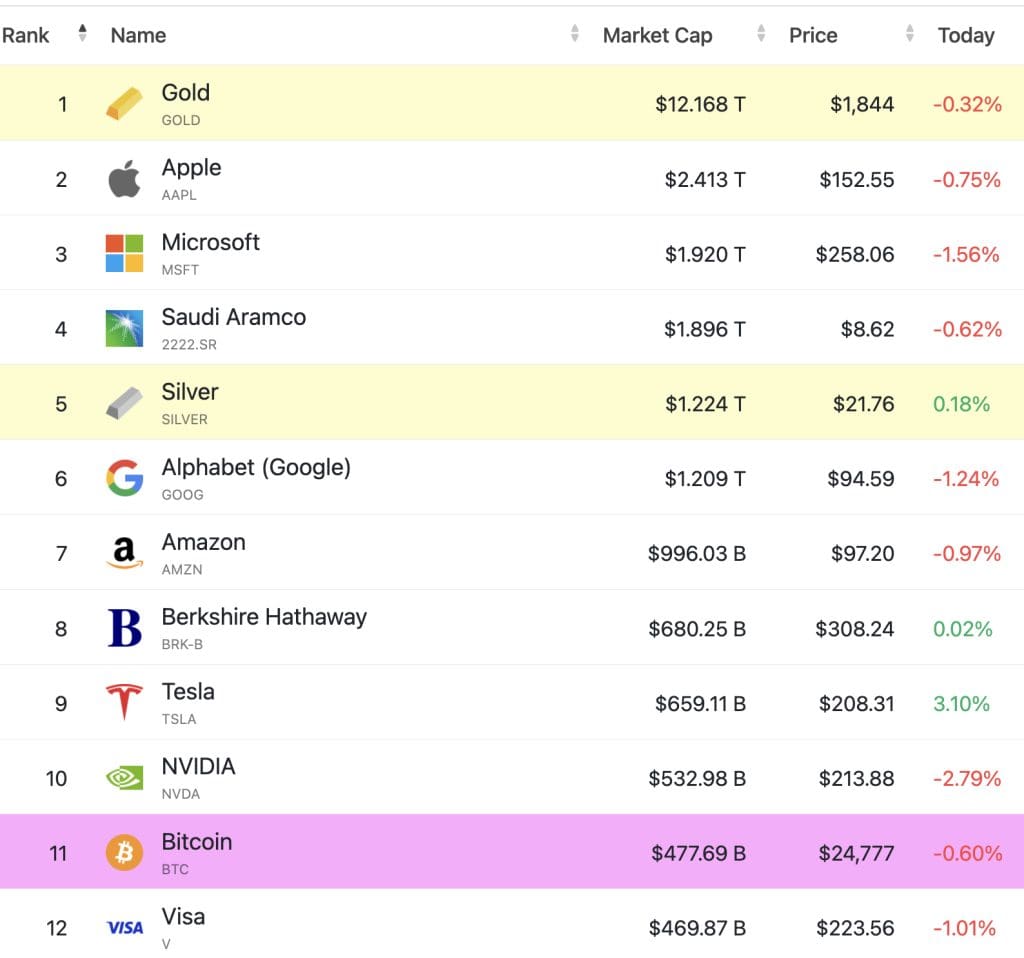
The latest data shows that Bitcoin’s market cap has surpassed that of Visa, a global card company.
According to data from Companies Market Cap, the market cap of the digital payments giant currently stands at $469.13 billion, $8 billion lower than that of Bitcoin at press time.
Top Assets By Market Cap

This makes Visa the 12th largest asset globally, one step behind the 11th-placed Bitcoin. The first time Bitcoin surpassed Visa in market value was in December 2020, when the price of the flagship cryptocurrency rose above $25,000 for the first time.
.
Bitcoin’s market cap is also approximately $133 billion more than 22-placed Mastercard’s $344 billion market cap, which is the second-largest digital payment company in the world.
The development comes days after Bitcoin printed its first “golden cross” on the four-hour chart since early January, as it briefly climbed above US$25,000 for the first time since August 2021. Will this “golden cross” propel BTC to $28,000?
Bitcoin Bulls Could Exploit An Ascending Triangle For 7.8% Gains
After dropping 6.40% to set a swing low at $23,477, Bitcoin has been recording a series of higher lows and relatively equal highs leading to the appearance of an ascending triangle on the four-hour chart (below).
This highly bullish chart pattern sets an upward target for the asset obtained by measuring the distance between the lowest and the highest part of the triangle (in terms of percentage change) and adding it to the breakout point at the pattern’s x-axis (resistance line).
In BTC’s case, a four-hour candlestick close above the triangle’s resistance line at $25,087 would confirm an upward breakout with the target of $26,698. Such a move would represent a 7.81% uptick from the current price. Higher than that, a rise to $28,000 would be the next logical move.
BTC/USD Four-Hour Chart

Several technical indicators supported Bitcoin’s positive narrative. First, the Relative Strength Index (RSI) was positioned in the positive region. The price strength at 57 suggested that there were still more buyers than sellers.
In addition, the bullish crosses from the moving averages were still in play. The February 18 “golden cross,” when the 50-period Simple Moving Average (SMA) crossed above the 200 SMA and the February 19 crossing over of the 50 SMA above the 100 SMA, were still intact. This implied that the market conditions still favored the upside.
Moreover, these SMAs were moving below the price, providing strong support for Bitcoin. On-chain metrics from IntoTheBlock, a blockchain data analytics firm, reinforced this vital support. Its In/Out of the Money Around Price (IOMAP) model showed that BTC sat on relatively firm reliance on the downside, compared to its resistance on the upside. This means the path with the least resistance to the BTC price is northward.
Bitcoin IOMAP Chart

The IOMAP chart above also shows that the immediate support at $24,000 was found within the $23,999 and $24,740 price range, where 1.13 million addresses previously bought approximately 482,240 BTC. Any attempts to push the price below this level would be met by immense buying from this cohort of investors who may want to minimize their losses.
The Flipside
On the other hand, the RSI was facing down, indicating that bears had begun re-entering the market. They could extend the ongoing correction to reach the triangle’s support line at $24,435.
BTC may drop below the triangle to seek solace from the $24,000 significant support level in highly bearish cases. Market participants could expect the pioneer cryptocurrency to take a breather here, allowing late investors to get in on the dip before staging another recovery.


