- Bitcoin price slipped under $22K on February 9, making investors wonder if the recent rally was a bull trap.
- With the U.S. awaiting news of the latest inflation data on Tuesday, investors hope that the news will trigger the direction the big crypto takes.
- Economists are predicting headlines of the CPI rising 0.5% month-over-month in January, which would be a significant leap from figures seen in the past few months.
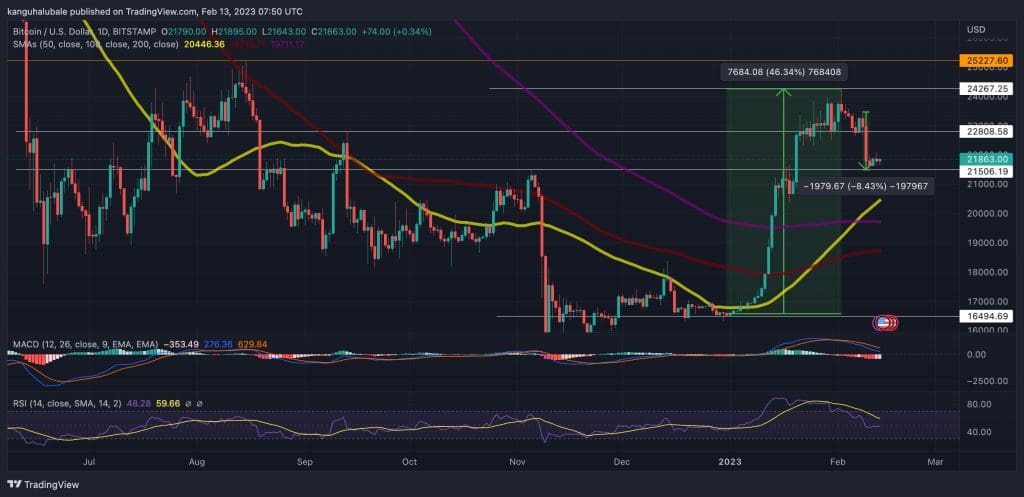
Following a successful three-week run that delivered Bitcoin (BTC) above the $22K mark beginning January 20, the king crypto lost momentum after the first week of February, dropping by over 8.43% to $21,793 on February 9. Since then, BTC price has consolidated under $22,000 as bears do their best to invalidate every bullish effort.
The global crypto market also shows the same struggle as populist altcoins like Ethereum and Polkadot, which also fell below significant levels. Consequently, the total valuation of the cryptocurrency market has dipped 0.46% in the last day to $1.01 trillion, which had been surpassed after two months of the bearish market outlook.
Despite Bitcoin being in a notably better position than where it had been mid-January, many investors were looking for its recent run to help it resume its rally above the $22K mark. Now, with the U.S. awaiting news of the latest inflation data on Tuesday, investors hope that the information will trigger the direction the big crypto takes and that the rest of the market will tag along with it.
Bitcoin Investors Remain Hopeful As Inflation Data Could Test Disinflation Optimism
The recent decline in BTC price hinted at the beginning of a bull trap that could mean massive losses to traders and investors exposed to the flagship cryptocurrency. However, in light of the news of the release of inflation data, the crypto market has some positive information to look forward to, as the upcoming policy decisions and inflation figures could help end the prolonged cryptocurrency winter.
January’s Consumer Price Index (CPI) from the Bureau of Labor Statistics is slated for release on Tuesday, February 14. With investors waiting in eagerness, the data will be heavily scrutinized, especially following Federal Reserve Chair Jerome Powell’s comments acknowledging the presence of “disinflation” in the U.S. economy.
Citing a February 8 Twitter post:
“Crypto prices continue their cautious move upwards after Federal Reserve Chair Jerome Powell’s comments on disinflation yesterday.”
As it were, Economists are predicting headlines of the CPI rising 0.5% month-over-month in January, which would be a significant leap from figures seen in the past few months. Although the monthly CPI figure probably increased in January, the annual headline number is expected to reduce from 6.5% to 6.2%.
Bitcoin Bulls Plan A Rally To $25,227 As Inflation Data Release Approaches
At the time of writing, BTC price was trading at $21,863 as bulls set their eyes on a new target. The price is trying to break out of the consolidation zone as the countdown to the release of CPI data continues.
An increase in buying pressure from the current level could set the tone for the BTC price to climb to the $22,800 level. Bulls could flip this hurdle into support if buying momentum remains intact past this level and use it to target the next barrier at $24,270.
In highly ambitious cases, the price could soar past the $25K level and tag the $25,227 level, which was last tested in June.
BTC/USD Daily Chart

The upward movement of the 50-day Simple Moving Average (SMA) supported the bullish outlook for BTC price as the price sat on immediate support at the $21,506 level.
The king crypto also had strong downward support embraced by the 50-day, 200-day, and 100-day SMAs at $20,446, $19,711, and $18,719, respectively. These were critical levels of buyer congesting that Bitcoin bulls could use in case they wanted a base for regrouping before staging a comeback.
On the downside, however, Bitcoin price could head south judging from the downward motion of the Moving Average Convergence Divergence (MACD) indicator, which suggested that buyers were leaving the market. The exit thesis was also supported by the histograms fading from deep red to pale red, indicating that the market favored bears.
In addition, the relative strength index (RSI) was at 48 and flattening out, signifying that bears were leading in the Bitcoin market.
As such, a daily candlestick close below the immediate support level at $21,500 could see the flagship cryptocurrency drop toward the $21,000 psychological level or the SMAs below it. In highly bearish cases, the BTC/USD pair may fall to revisit the $16,500 support floor.


