The markets enjoyed a positive start to the week after an explosive Friday session left US stocks soaring and Bitcoin bleeding after dropping 6.63% in the wake of the news on the crypto-friendly bank Silvergate.
The Silvergate Capital Corporation (SI) stock price is down 6.24% on the day, reaching an all-time low of $5.41. This follows the crypto bank’s admission last week that it had been forced to sell more debt at a loss.
In the wake of the FTX collapse, Silvergate suffered an $8.1 billion bank run due to its relations with the defunct exchange, as top crypto providers – including Coinbase and Crypto.com – raced to secure USDC stores. This led to the bank selling securities worth billions of dollars to cover the sudden customer withdrawals. The bank later reduced crypto-related deposits to distance itself from the industry, resulting in a $14 billion decline in deposits.
Despite this, US equities closed last week with a sterling performance. The S&P 500 and the NASDAQ enjoyed solid rebounds as the US dollar remained suppressed and failed to rise higher.
Much to the disappointment of crypto traders, Bitcoin suddenly doubled to $22,000 as 10-year treasury bonds recorded a four-month high ahead of expected rate hikes from the Federal Reserve.
At the time of writing, the big crypto has rallied 0.1% over the last 24 hours to $22,412. The recovery might be over for Bitcoin, at least for the moment, and here are a couple of reasons why.
Reasons Why Bitcoin Price Will Remain Bearish
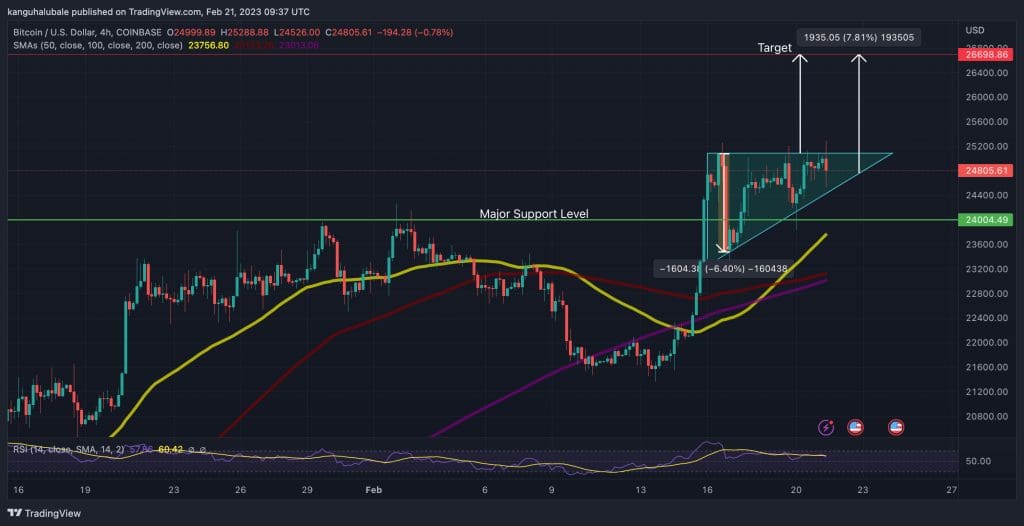
The flagship cryptocurrency started recovering on January 1, making a 52.34% leap upward. The buyers tried to sustain the price above $25,000 but were rejected by overhead pressure from this supplier congestion zone. When the BTC price turned away from this level, it recorded a series of lower highs and lower lows, leading to a descending parallel channel on the daily chart (see below). This meant that a correction was inevitable, threatening the return of the crypto’s price to January 18 levels.
Unfortunately, the correction appears to have played out as expected. After trading in a brief downtrend, the Silvergate news saw the price lose a critical support level provided by Thursday’s 50-day Simple Moving Average (SMA). At the time of writing, the pioneer cryptocurrency was still trading within the confines of the channel, meaning that increased selling from the current level could send it tumbling to hit the technical target of $21,000. This would represent a 6.31% drop from the current price.
BTC/USD Daily Chart

Besides the technical chart, Bitcoin’s bearish narrative was supported by the downward-facing 50-day SMA and the crossing of the MACD below the zero line into the negative region. This suggested the market still favored the sellers. BTC’s downward trend will gain momentum once the MACD moves deeper into the negative territory.
The Relative Strength Index (RSI) was also positioned in the negative region. The price strength at 43 suggested more sellers than buyers, adding credence to the gloomy outlook.
The technical formation also revealed that the Bitcoin price has been struggling with recovery over the past four days because of the relatively robust resistance on the upside. These were the $22,700 barrier embraced by the upper boundary of the falling channel and the $23,000 supply zone, where the 50-day SMA sat.
On-Chain Metrics Attest To The Stiff Resistance
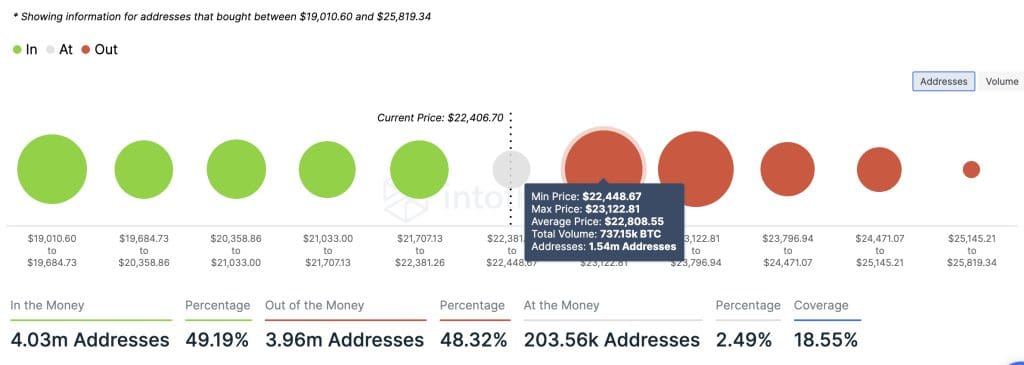
The most crucial area of resistance is the one defined by the upper boundaries of the channel and the 50-day SMA between $22,700 and $23,000. The importance of this supplier congestion zone was emphasized by on-chain metrics from IntoTheBlock’s In/Out of the Money Around Price (IOMAP) model, which showed that this resistance is relatively stiff compared to the areas of support that the coin sat on.
This is where roughly 1.54 million addresses previously bought approximately 737,150 BTC. Any attempts to push the price above the channel would be met by immense selling from this cohort of investors who may wish to break even. The ensuing supply pressure would cause the BTC price to drop even lower.
BTC IOMAP Chart

BTC Price May Reach These Levels
Noteworthy, if bulls can overcome the sellers in the current battle for control, the ongoing recovery may continue in the near term, taking the price above the channel’s upper boundary. The next move higher would see Bitcoin rise above the 50-day SMA at $23,000, confirming a bullish breakout.
This would clear the path for BTC to climb higher toward the $25,000 psychological level. Market participants could expect the upside for the most significant crypto by market capitalization to be capped here in the short term.


