- Bitcoin price surged more than 16% to trade above $26,000 after CPI data came in as expected on Tuesday.
- BTC still looks strong as the technical set up and indicators show on the daily timeframe.
- A daily candlestick below the 50-day SMA at $23,000 would trigger massive sell orders to areas below $20,000.
Bitcoin bulls remain ecstatic, as crypto markets momentarily surged after the US Consumer Price Index (CPI) data came in as expected. This came amidst turmoil in the US banking sector, resulting in capital inflow into Bitcoin as the asset’s power as a hedge against inflation increased.
Reasons Why Bitcoin Broke Above $26,000
Bitcoin’s price rose as much as 16% on Tuesday as the latest Consumer Price Index (CPI) data for February 2023 came in as expected. BTC flashed above $26,500, levels last seen in June 2022, as its market cap crossed the half-a-trillion mark.
Ethereum, the second largest cryptocurrency by market capitalization, spiked 9.67% on the day to brush shoulders with $1,750 as the global market capitalization surged back above the $1 trillion mark and now stands at $1.08 trillion, according to data from CoinMarketCap.
The short-term gains were triggered by the United States Department of Labour’s release of core CPI data, which removes volatile food and energy prices, showing a monthly increase slightly above economists’ expectations and a year-over-year change in line with what was expected.
CPI rose by 0.4% in February 2023, a slight dip from January’s 0.5% – in line with economists’ expectations surveyed by Dow Jones. On an annual basis, the CPI rose 6.0% in February compared to January’s 6.4%. The core CPI gained 5.5% in the 12 months through February after advancing 5.6% in January.
The US Department of Labour also noted that the all-items index denoting inflation increased by 6% over the last 12 months. Despite the dip, market participants are still anticipating a 25-basis-point rate hike at The Federal Open Markets Committee (FOMC) meeting in March.
Bitcoin Price Analysis – Where Next BTC?
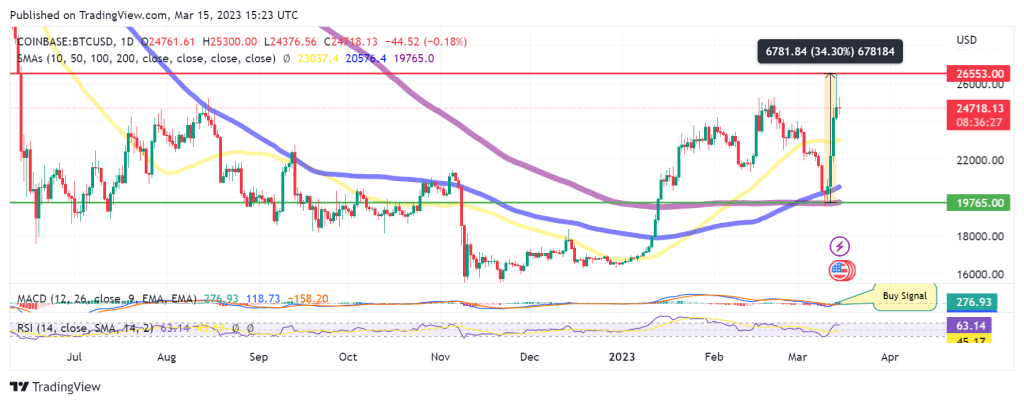
Conventional Finance markets responded with volatility after releasing the CPI data, with the pioneer cryptocurrency reacting positively before being rejected by the $26,000 supplier congestion zone. Tuesday’s surge brought the total gains to 34.3% between Saturday, March 11, and Tuesday, March 14.
When writing, Bitcoin traded at $24,718, up 0.25% on the day as bulls and bears fought for control. This hinted at consolidatory action setting the big crypto up for another leg up.
The Moving Average Convergence Divergence (MACD) was moving upward above the neutral line, indicating that the market still favored the upside. Note that the call to buy Bitcoin that was sent by the MACD on Monday when the 12-day Exponential Moving Average (EMA) (blue) crossed above the 26-day EMA (orange) was still in play, adding credence to the bullish outlook.
BTC/USD Daily Chart

Additionally, the moving averages were facing up, and Relative Strength Index (RSI) was moving upward toward the overbought region. The price strength at 63 suggested that the buyers controlled Bitcoin. BTC’s uptrend will gain momentum once the RSI crosses the 70 lines into the overbought region.
As such, if bulls prevail over the bears in the ongoing battle, Bitcoin’s price may turn up from the current levels, with the first line of resistance emerging from yesterday’s high above $26,500. Overcoming this barrier would open the path for a move to $28,000 and, later, $30,000 in the near term.
Conversely, if sellers carry the day, Bitcoin would turn down, as evidenced by the near-overbought conditions painted by the RSI. BTC may drop to tag the $24,000 psychological level and later below the 50-day Simple Moving Average (SMA) just above $23,000. A move lower could see the asset drop to revisit the local low at $19,765, where the 200-day SMA sat.


