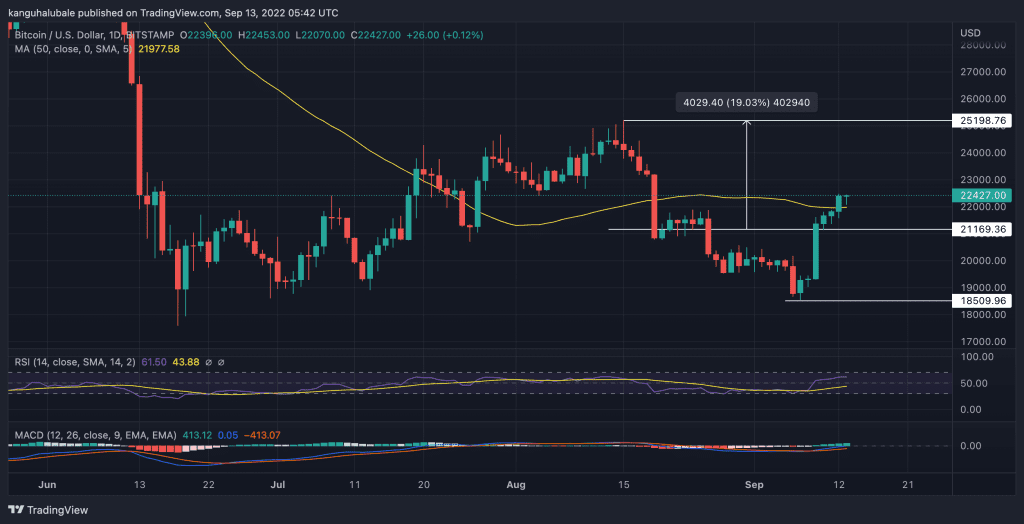
Bitcoin (BTC) extended its rally ahead of the much-awaited Ethereum Merge, breaking out confidently, displaying a near 20% gain, and rallying into significant resistance at $23,000.
The U.S. equities markets also started the week on a solid footing, suggesting that investors could expect the Federal Reserve to increase interest rates by a 75 basis point during the meeting scheduled between September 20 to 21. It could also mean that investors believe that inflation has reached its peak.
BTC and the broader crypto market may also be turning bullish because of the Ethereum Merge. This is an upgrade on the Ethereum blockchain that will see the smart contracts protocol transition from proof-of-work (PoW) to a proof-of-stake (PoS) consensus mechanism. The change, which will take place on September 15, is expected to reduce the network’s energy consumption by approximately 99.95%. In addition, the introduction of sharding in the first quarter of 2023 is expected to make the platform highly scalable and in line with centralized payment processes like Visa and MasterCard.
Bitcoin Price Needs To Reclaim The $25,000 Level To Confirm A Breakout
The strength displayed by Bitcoin could also mean that the elusive bottom might be finally here. Bitcoin’s rally above $22,000 cleared the resistance the 50-day simple moving average (SMA) provided, now sitting around $21,970.

This uptick also saw the flagship cryptocurrency shatter a closely watched metric – the realized price – at $21,700, according to data from Glassode. The next major roadblock lies near the $23,000 psychological level.
A daily close above the $23,000 level could indicate that the bear market may have ended. If this happens, BTC may climb to clear the $23,000 to $25,000 supply zone to tag the range high at $25,198, reached on August 15. Such a move would represent a 19% move from the current price.
This optimistic outlook is supported by the technical setup on the daily chart. First, Bitcoin is trading in a seventh straight bullish session on the daily chart, suggesting that the buyers have returned to the scene. In addition, the relative strength index (RSI) is in the positive region, meaning that the price market has flipped in favor of the upside. The price strength at 61 implies that the buyers have taken control of Bitcoin’s price.
Moreover, the moving average convergence divergence (MACD) indicator has crossed the neutral line and is now in the positive region. This trend-following oscillating indicator suggests that the market sentiment has flipped bullish. BTC’s upward momentum will gain more traction as the MACD moves further into the positive region.
Of course, many other on-chain indicators and derivatives data could help put Bitcoin’s current price action in context. However, the focus of the recent article was to provide a brief analysis and a snapshot interpretation of the big crypto’s market action and consider where the price may move in the near term.
As such, if the price turns down from the current level and breaks below the 50-day SMA, it will indicate that traders continue to sell on rallies. The crypto could then drop to tag the $21,170 support zone or move further down to revisit the strong support at $18,500.


