
- Bitcoin is approaching the 365-day moving average near $100K–$101K
- A reclaim could signal trend continuation, while rejection raises downside risk
- Momentum suggests stabilization, not a confirmed breakout yet
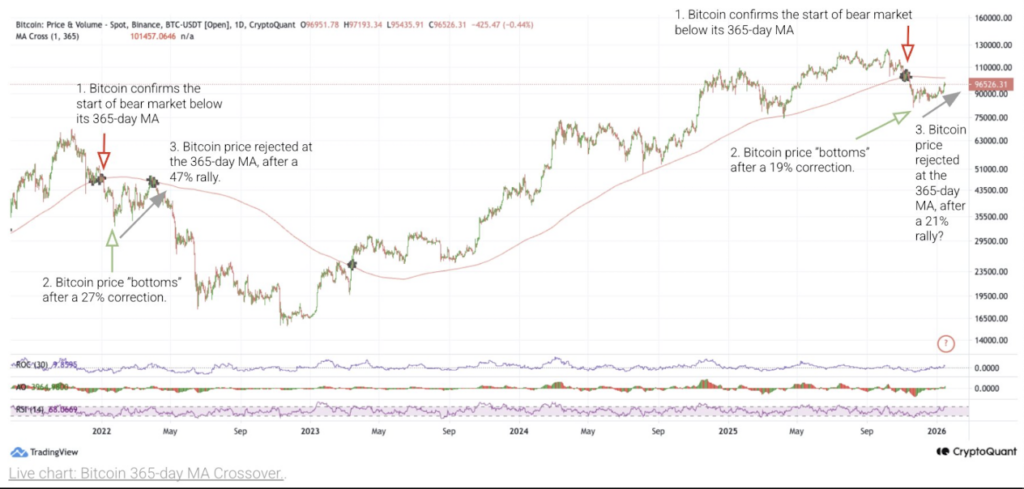
Bitcoin is drifting back toward a level that traders don’t ignore, even if they pretend to sometimes. Price is once again approaching the 365-day moving average, a long-term trend line that carries real weight across cycles. According to CryptoQuant data, this zone is sitting just above current price, and history says it’s not something Bitcoin crosses casually.
Why the 365-Day Moving Average Is a Big Deal
During the 2022 bear market, this same moving average acted like a hard ceiling. Bitcoin rallied into it, stalled, failed to reclaim it, and then rolled over into a much deeper drawdown. That moment marked the difference between a temporary bounce and a prolonged downtrend. It’s why this level still matters today, maybe more than most people want to admit.
Right now, the 365-day MA sits around the $100,000 to $101,000 range. Bitcoin is trading below it, which keeps the market in a defensive posture. In long-term trend analysis, reclaiming this line usually signals strength and continuation. Failing to do so keeps rallies vulnerable.
How This Setup Compares to Past Cycles
Looking back at previous cycles, the pattern is pretty clear. In 2022, Bitcoin dropped below the 365-day MA, staged a recovery rally of about 47%, and then got rejected. Only after a much deeper correction did price finally carve out a durable bottom.
This time around, Bitcoin has already pulled back roughly 20% from recent highs. That kind of move lines up more with mid-cycle corrections than full capitulation events. The open question is whether that pullback was enough, or if the market still needs to work through more supply before moving higher.
What Happens Next Depends on This Zone
This isn’t just another technical line. Long-term holders, funds, and systematic strategies all watch this level closely. When Bitcoin trades below it, rallies tend to get sold into. When price holds above it, dips usually find buyers.
At the moment, Bitcoin is stuck in between. The bounce is there, but confirmation is not. A rejection near $100K–$101K would start to resemble the early stages of the 2022 structure. On the flip side, a clean daily and weekly close above the 365-day MA would seriously weaken the bearish argument and suggest that selling pressure has been absorbed.
Momentum Signals Call for Patience
Momentum indicators aren’t screaming in either direction. RSI has recovered from oversold levels but isn’t showing strong bullish divergence. Volume during the rebound has been decent, though far from explosive. That usually points to stabilization rather than acceleration.
Markets that look like this often chop around and frustrate both sides before choosing a direction. It’s not exciting, but it’s honest price behavior.
A Balanced View of the Risk
This chart doesn’t guarantee a bear market. It does, however, justify caution.
Bitcoin is sitting at a decision point. Bulls need to reclaim and hold the 365-day moving average. Bears are watching closely for another rejection to confirm that this move is corrective, not structural. Until one of those outcomes plays out, sharp moves in either direction remain very much on the table.
In simple terms, this is not a place for complacency. How Bitcoin interacts with this level could shape not just the next few weeks, but the broader trend for the rest of the year.