
- Bitcoin is holding near $67K support, backed by strong AVWAP and volume cluster confluence
- A deeper move toward $57K–$58K remains possible as multiple indicators align below
- Market direction depends on whether BTC holds current support or breaks into a deeper correction zone
Bitcoin right now feels… caught in between. Not exactly weak, but not fully strong either, just hovering in a space where two key support narratives are starting to clash a bit. One side points to $67,000 as a solid defensive zone, while another suggests the market might not be done dipping—possibly sliding toward $57,000–$58,000 before anything meaningful happens.
That tension is what makes this setup interesting. It’s not a clear breakdown, not yet anyway, but it’s also not a confident bounce. Instead, BTC is sitting right in the middle of a decision point, and markets like this don’t usually stay quiet for long.
Strong Support Builds Around $67K
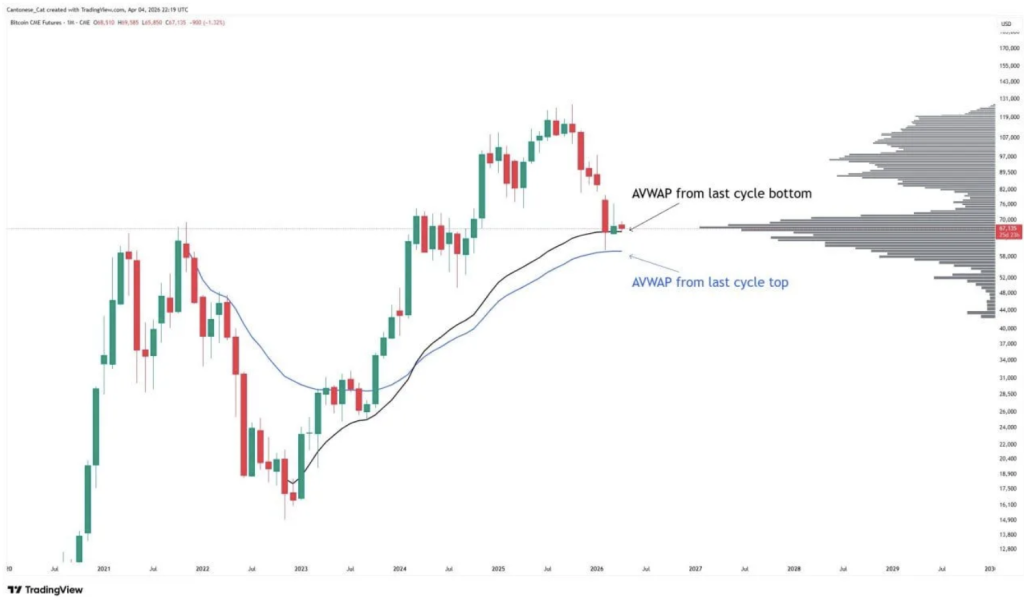
Looking at the CME futures chart shared by Cantonese Cat, there’s a pretty compelling case for support around $67K. It’s not just one indicator holding things up—it’s several, layered together in a way that tends to grab attention from traders. Anchored VWAPs from both the last cycle bottom and top are sitting right around this area, almost stacked.
Then there’s the volume shelf. That’s key. It shows heavy past trading activity in this zone, meaning price isn’t just drifting into empty space. It’s moving into an area where buyers and sellers have already battled it out before… and that kind of history tends to matter.
So in theory, this cluster should slow things down. Maybe even hold. But—and this part’s important—support doesn’t promise a bounce. If price breaks through with enough force, it could actually trigger the opposite effect, opening the door for sharper downside as expectations fail.
A Deeper Retest Still on the Table
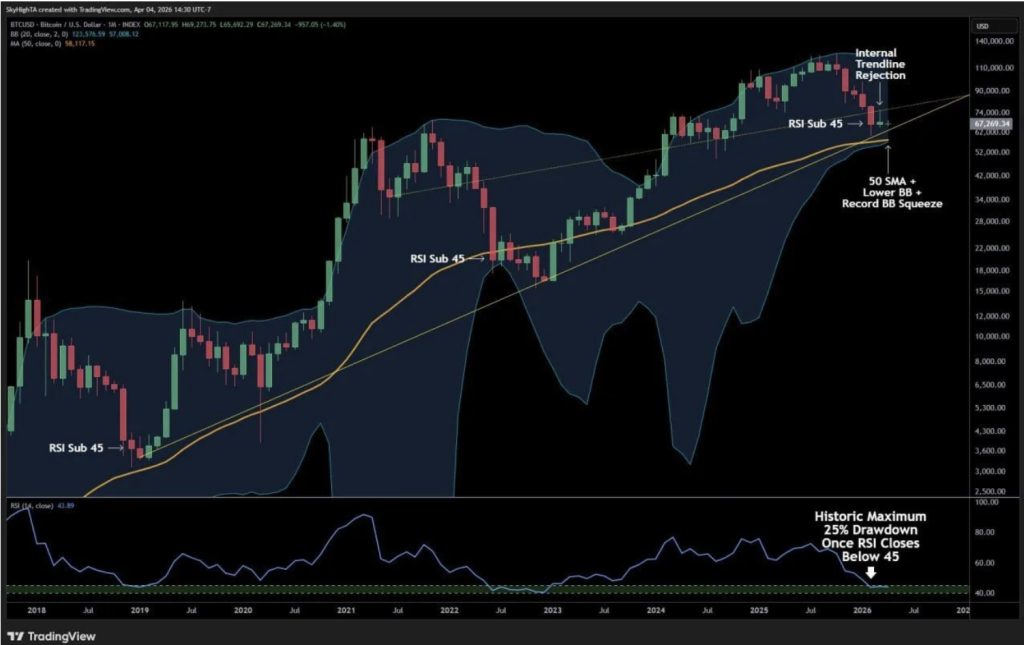
Now, shifting over to the second chart from Super฿ro, the picture changes slightly. This view leans more cautious, suggesting Bitcoin might still need one more drop before finding stronger footing. The key zone here sits lower, around $57K to $58K, where multiple indicators begin to line up again.
You’ve got the 50-month SMA around $58,117 and the lower Bollinger Band near $57,008, both converging in that same region. Add in the untouched primary uptrend line, and suddenly this area starts to look like a magnet… not a breakdown level, but more like a deeper reset point.
It’s not necessarily bearish, just… unfinished. Like the market hasn’t fully completed its correction yet.
RSI Hints at More Room to Move
The RSI adds another layer to this whole thing, and it’s not exactly screaming strength. Sitting around 43.89, it’s below that 45 threshold that’s been tested multiple times in the past. Historically, dips below that level have sometimes led to drawdowns of up to 25%, which, while not guaranteed, does suggest there’s still room for price to stretch lower.
Again, this doesn’t mean BTC has to drop. Markets don’t follow scripts that cleanly. But it does explain why some analysts are still cautious, even with support sitting just below current levels.
Not a Breakdown, But Not a Bottom Yet Either
Zooming out a bit, the bigger structure hasn’t actually broken. The primary uptrend line is still intact, and price is compressing into a zone where long-term support lives. That’s important, because it shifts the narrative away from panic and more toward a controlled reset.
So maybe this is just a shakeout phase. A flush, a bit of pressure, maybe a quick wick lower to clear weak hands before things stabilize again. Or maybe not—if support fails decisively, the downside case becomes harder to ignore.
For now, though, the key takeaway is pretty simple. Bitcoin is approaching a critical zone, roughly between $57K and $67K, and whichever side wins out here will likely shape what comes next.