
- Bitcoin rebounds above $70K, but trend strength remains weak and unconfirmed
- Repeating wedge pattern suggests potential for another rejection and downside move
- A confirmed breakout above resistance is needed to shift sentiment bullish long-term
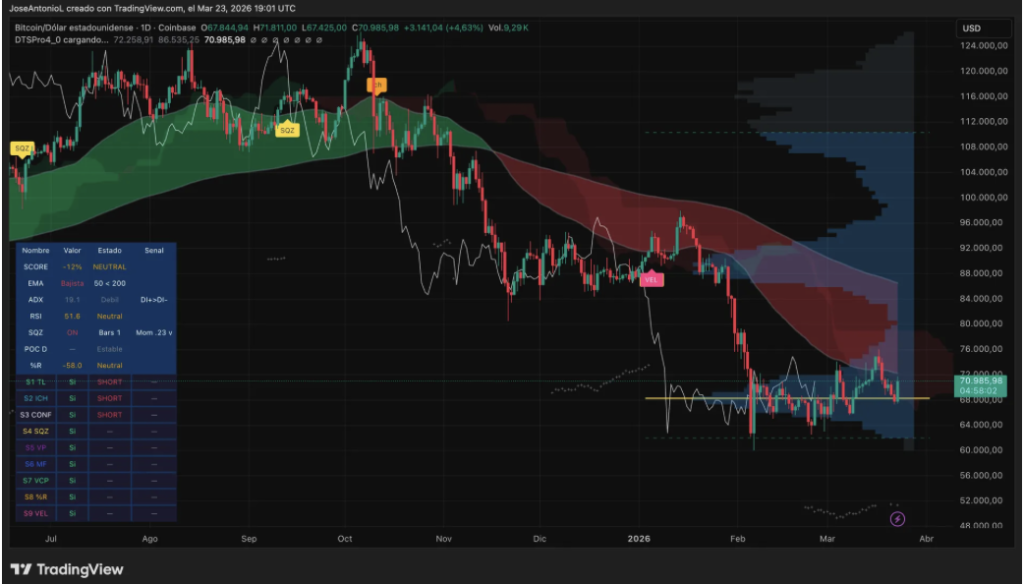
After a rough February that dragged Bitcoin from the mid-$90Ks all the way down to around $59,000, the market finally has a bit of relief. BTC is up roughly 4.6% now, trading near $71,000, and for a moment… it feels like the worst might be behind. Sentiment has eased slightly, fear isn’t as loud as it was a week ago. But if you look a little closer, things aren’t exactly clear.
Because while price is bouncing, the chart is quietly forming something familiar, and not in a good way.
A Relief Rally, but Not a Strong Trend
Zooming into the numbers, Bitcoin pushed from around $67,800 up to nearly $71,800 before settling just under $71K. It’s a solid move, no doubt. But it’s also testing a key level, the 200-day average, which tends to act like a dividing line between bullish and bearish territory.
Now here’s where it gets a bit… mixed. The ADX, which measures trend strength, is sitting at 19. That’s below the 25 level traders usually look for to confirm a real trend. In simple terms, this bounce doesn’t have strong conviction behind it yet. It’s movement, yes, but not momentum, not really.
The EMAs tell a similar story. The short-term average is still below the long-term one, which keeps the broader trend pointing downward. Even with green candles popping up, the underlying structure hasn’t flipped. Not yet anyway.
Indicators Say “Wait,” Not “Buy”
The RSI is hovering around 51, right in the middle. That’s not oversold, not overbought, just neutral, which kind of sums up the market mood right now. It’s not panicking anymore, but it’s not confident either.
Then there’s the Squeeze Momentum indicator, which shows the market is compressing, like a spring being slowly tightened. The reading is low, around 0.26, meaning energy is building, but direction? Still unclear. These setups can lead to big moves, but they don’t tell you which way until it actually happens.
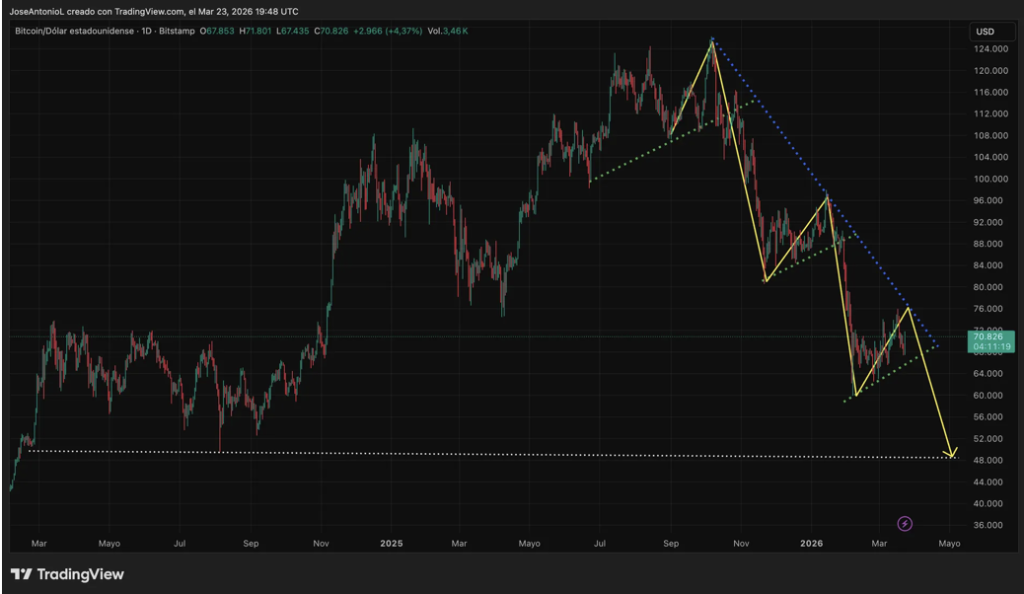
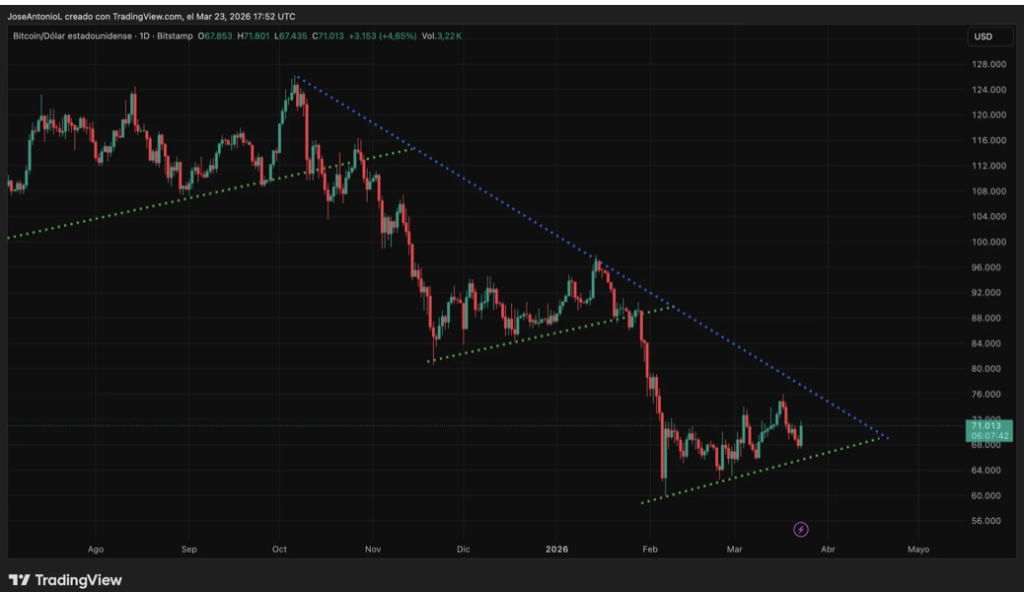
A Pattern That’s Failed Before… Twice
This is where things get a bit uncomfortable. The chart is forming a structure we’ve already seen play out twice recently, and both times ended with sharp drops. There’s a descending resistance line coming down from the $125K peak, acting like a ceiling. And below, ascending support lines are pushing price upward, squeezing it into a tightening range.
It’s basically a wedge, and Bitcoin keeps bouncing between these levels. The problem is, in previous instances, once price got squeezed enough and hit resistance, it didn’t break out, it broke down. First after the October 2025 peak, then again after the January 2026 recovery. Both times led to heavy losses.
And now… it’s happening again. Same structure, same compression. If history repeats, another rejection around this resistance zone, maybe sometime in April or May, wouldn’t be surprising.
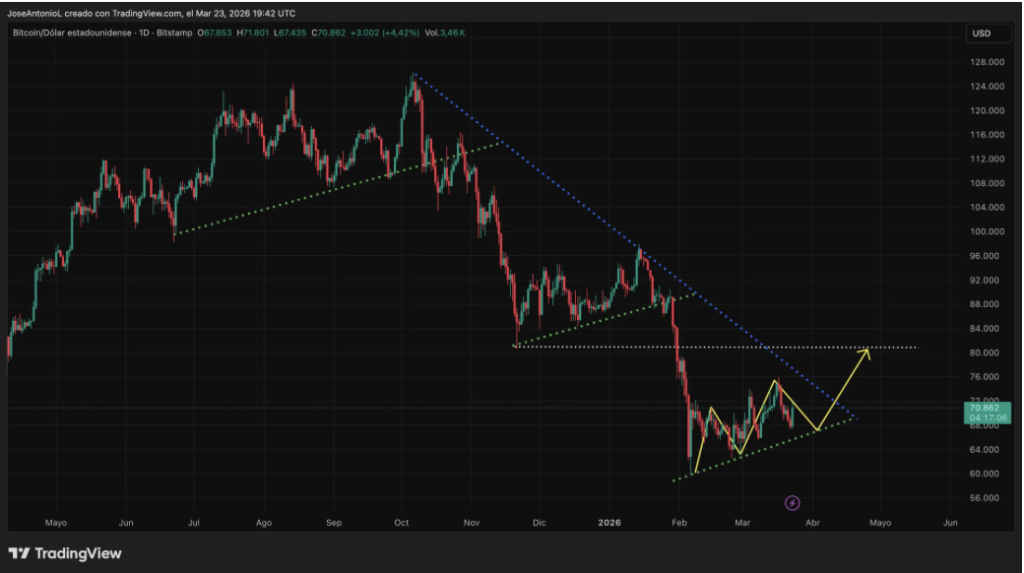
One Break Could Change Everything, But It Hasn’t Happened Yet
There is a way this flips bullish, though. If Bitcoin can break above that descending resistance line with strong volume, and actually close above it, not just wick into it, that would change the narrative. A proper breakout could signal that the bottom is in, somewhere around the $59K–$64K zone.
If that happens, the next target starts to look like $80K, maybe higher if momentum builds. But that’s a big “if,” and right now, the market hasn’t done it. It’s still stuck beneath that ceiling.
So while the short-term bounce looks nice, and it does, the broader pattern hasn’t broken. And until it does, there’s always that risk hanging in the background, that this is just another setup before the next move down.