- XRP is showing multiple bullish technical signals after weeks of heavy selling pressure.
- Analysts say rare chart patterns and the lowest RSI reading in 13 years could signal a market reversal.
- Holding above key support may pave the way for XRP to climb toward $1.30 in the coming weeks.
XRP may finally be showing signs that its long decline is starting to slow down. After several weeks of relentless selling, the cryptocurrency is beginning to flash a handful of technical signals that traders often associate with market bottoms.
Although XRP still trades well below its recent highs, analysts believe the latest price action suggests sellers are losing momentum while buyers slowly return to the market.
Two separate technical studies have strengthened that view, pointing to a possible trend reversal if current support levels continue to hold.
Bullish Chart Patterns Begin to Appear
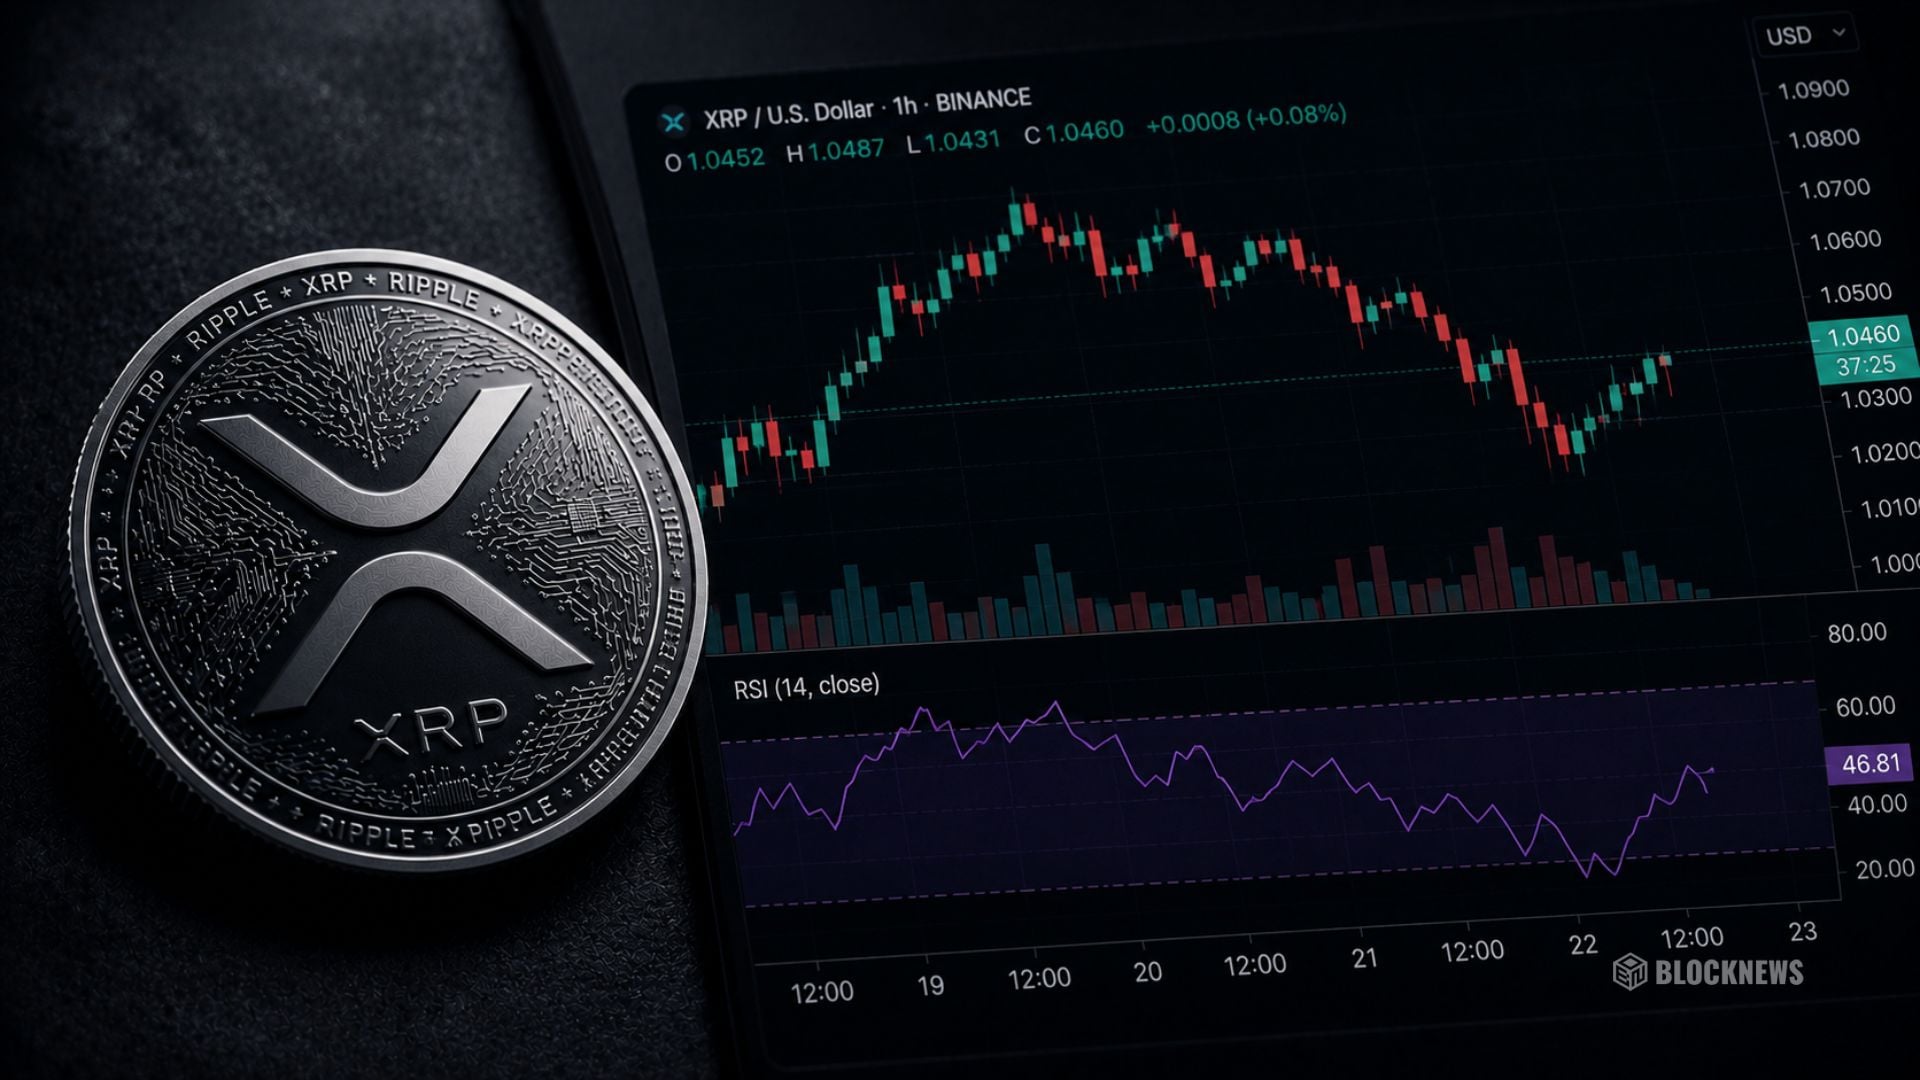
XRP has spent the past several weeks sliding lower, falling from the $1.20-$1.25 range down to the important psychological support level near $1.02. Every recovery attempt was quickly rejected, allowing bears to stay firmly in control.
Now, however, the charts are starting to tell a slightly different story.
According to crypto analyst Ali Charts, XRP has formed two well-known bullish reversal patterns on the daily timeframe. The first is a Tom DeMark Sequential buy signal, while the second is a Morning Star Doji formation that developed just above the $1.02 support zone.
Together, these signals often suggest that selling pressure is fading and buyers are gradually stepping back in.
XRP has already rebounded toward the $1.07 area, but analysts say that isn’t enough just yet. For the recovery to gain real momentum, the token needs to establish support between $1.07 and $1.10 while attracting stronger trading volume.
If that happens, the next resistance levels come into focus around $1.15 and $1.21, with some analysts eyeing a move toward $1.30 if bullish momentum continues to build.
Long-Term Trend Still Points Higher
Despite the sharp correction, CryptoLlica believes XRP’s broader market structure remains surprisingly healthy.
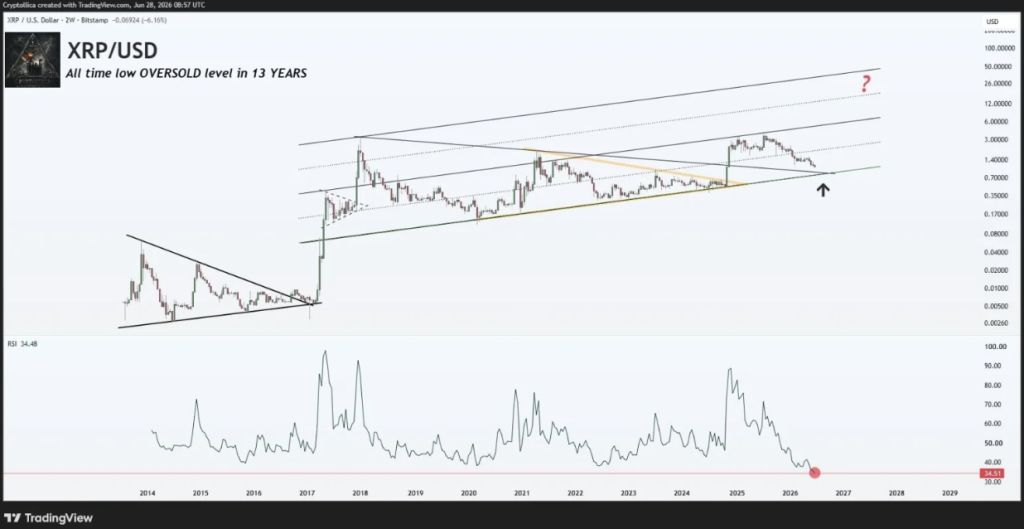
Since 2017, XRP has continued trading inside a long-term rising channel, and the latest decline has brought the token back toward the lower boundary of that formation. Historically, this area has acted as a launchpad for significant recoveries.
Previous corrections between 2014 and 2017, as well as the 2021 to 2024 cycle, eventually ended with strong breakout moves after extended periods of consolidation.
That historical pattern is one reason some traders remain optimistic despite the recent weakness.
Rare RSI Signal Adds to Bullish Case
One of the strongest arguments for a potential recovery comes from XRP’s Relative Strength Index, or RSI.
CryptoLlica noted that the indicator has dropped to roughly 34, marking the most oversold reading since XRP first launched more than 13 years ago.
Readings this low have been extremely rare throughout the asset’s history and have often been followed by lengthy periods of buying pressure. While an oversold RSI doesn’t guarantee an immediate rally, it typically signals that bearish momentum is beginning to fade.
If buyers continue defending current support levels, XRP could be setting the stage for a much larger recovery in the weeks ahead.