- Zcash has recovered strongly from its early-2026 lows and is now trading well above key support zones.
- Analysts are watching a rounded bottom pattern, bullish moving averages, and a possible breakout setup.
- ZEC still needs to clear major resistance before a larger move toward previous highs becomes more realistic.
Zcash is starting to draw fresh attention again after recovering from its early-2026 lows. The privacy-focused cryptocurrency has moved back into the mid-$400 range, giving traders a reason to revisit the chart after months of weakness and sideways action. While the broader technical picture is not fully bullish yet, several analysts believe ZEC may be building the foundation for another move higher.
The recent rebound has placed Zcash above several important support levels, including the widely watched $350 zone. That level now appears to be one of the most important lines for bulls to defend. If it continues holding, the recovery structure remains alive. If it breaks, well, the bullish argument becomes much harder to defend.
Zcash Forms a Rounded Bottom Pattern
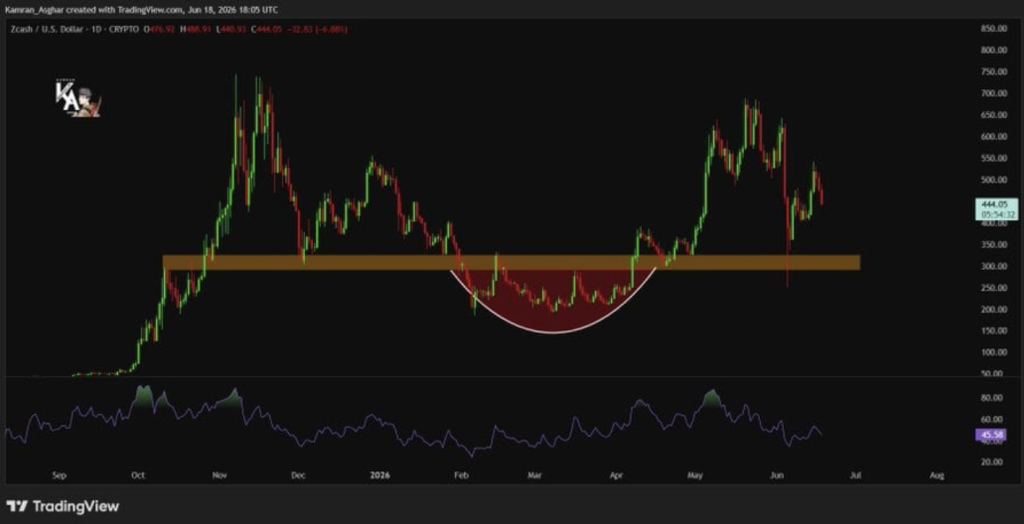
Market analyst Karman recently pointed to a rounded bottom pattern on the ZEC chart, suggesting that months of selling pressure may have gradually weakened. The structure developed after Zcash dropped from highs near $800 in 2025 before stabilizing and beginning a slow recovery through the first half of 2026.
This U-shaped formation is often viewed as a sign that sellers are losing control while buyers slowly return. It is not always explosive at first. Sometimes, the market just grinds higher quietly before momentum becomes more obvious.
According to the analysis, ZEC’s ability to remain above the $350 support zone is central to the bullish setup. The chart showed Zcash trading near $444 on June 18, with improving volume and momentum indicators. Still, traders are watching for stronger participation before calling it a confirmed breakout.
Resistance Remains the Big Test
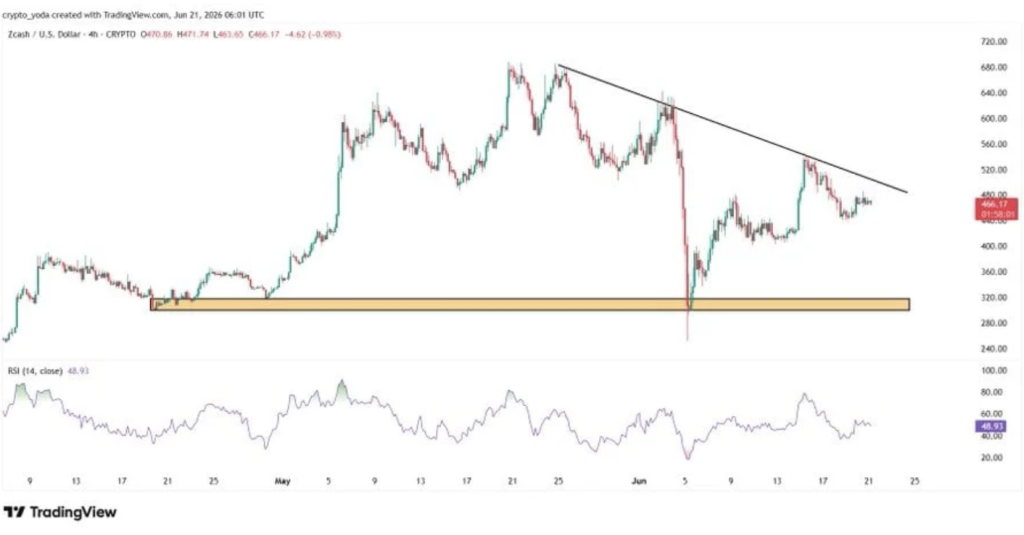
Another analyst, CryptoYoda, highlighted a long-term descending trendline that has capped Zcash rallies since its previous highs. This resistance has become a major technical barrier, and ZEC is now trading close enough to test it again.
Before reaching this area, Zcash bounced from a major demand zone between $290 and $310. That recovery pushed the token back toward the $460-$470 region, putting it directly under the descending resistance line.
The setup is balanced for now. The RSI on the four-hour chart was near 49, which points to neutral momentum rather than an overheated market. That gives bulls some room to work with, but it also shows that buyers have not fully taken charge yet.
A clean breakout above the descending trendline could strengthen the bullish case and possibly open the door for more upside. But if sellers defend that level again, ZEC may need more consolidation before attempting another push.
Moving Averages Support the Recovery
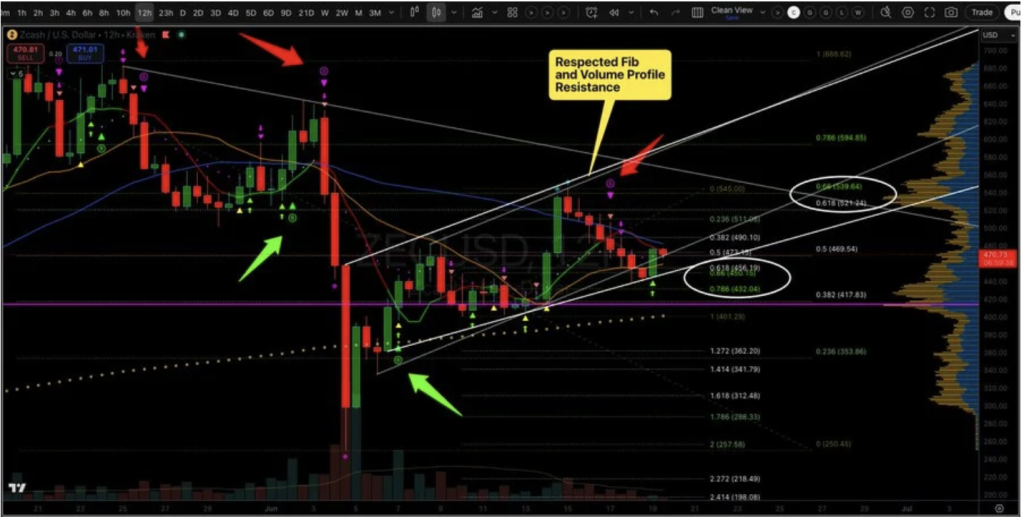
Additional analysis from CryptDollar suggests that shorter-term trend signals are still leaning positive. ZEC has been testing trendlines and a key Fibonacci golden pocket area while holding near the 8-period and 20-period moving averages around the $470 region.
That kind of support can be important during a recovery phase. When price continues respecting short-term moving averages, it often shows that buyers are stepping in on dips rather than waiting for deeper pullbacks.
The broader bullish view remains intact as long as ZEC stays above the 50-period moving average and continues respecting its underlying trend support. However, the setup is not without risk.
If Zcash loses the current structure, analysts warn that a bear-flag scenario could develop. In that case, ZEC may slide back toward the $400-$420 range. That would not completely destroy the recovery trend, but it would likely delay any attempt to challenge higher resistance levels.
Technical Indicators Stay Neutral but Improving
TradingView data gives a more cautious view of ZEC’s current condition. The broader technical summary for ZEC/USDT remains neutral, showing that major indicators are not fully aligned yet.
Oscillators such as RSI, Stochastic, CCI, MACD, and Williams %R are mostly sitting in neutral territory. In plain terms, Zcash does not look extremely overbought or deeply oversold at current levels.
That actually makes sense given the recent price action. ZEC has already recovered from key support, but it has not broken strongly enough through resistance to confirm the next major leg higher.
Moving averages, however, continue to lean bullish. Short-term and medium-term outlooks, including one-week and one-month signals, remain in buy territory. This mix of neutral oscillators and bullish moving averages often points to a transition phase, where the market is deciding whether to continue higher or cool off first.
What Could Drive Zcash’s Next Move?
For Zcash, the next major move likely depends on whether buyers can turn resistance into support. A breakout above the descending trendline would give bulls a stronger argument and could shift attention toward higher price levels that have not been tested since the 2025 decline.
On the downside, failure to break resistance could lead to another round of consolidation. The $400 region would be the first area to watch, followed by the much more important $350 support zone. As long as ZEC holds above that level, the rounded bottom structure remains valid.
For now, Zcash appears to be in a cautiously bullish recovery phase. The path back toward previous highs near $800 would require several resistance levels to be cleared, so it’s not exactly a straight road. But with support holding, moving averages improving, and breakout traders paying attention again, ZEC is back on the market’s watchlist.