- ADA has rebounded more than 10% recently, but derivatives data still paints a mixed picture.
- Funding rates have turned positive even as many traders continue betting against Cardano.
- Technical indicators suggest bearish momentum is fading, though major resistance levels remain overhead.
Cardano has managed to claw back some ground after a difficult stretch, but the market still seems unsure about what comes next. ADA is trading near $0.180 on Monday, taking a breather after posting a recovery of more than 10% over the previous week. The bounce has helped reduce immediate selling pressure, yet traders remain split on whether this is the beginning of a larger recovery or simply a temporary pause.
That uncertainty is showing up across multiple market indicators. Some data points are leaning bullish, others still favor caution. As a result, Cardano finds itself in a bit of a tug-of-war between buyers looking for a turnaround and sellers who remain unconvinced.
Derivatives Market Reveals Conflicting Sentiment
A closer look at derivatives data highlights just how divided traders currently are.
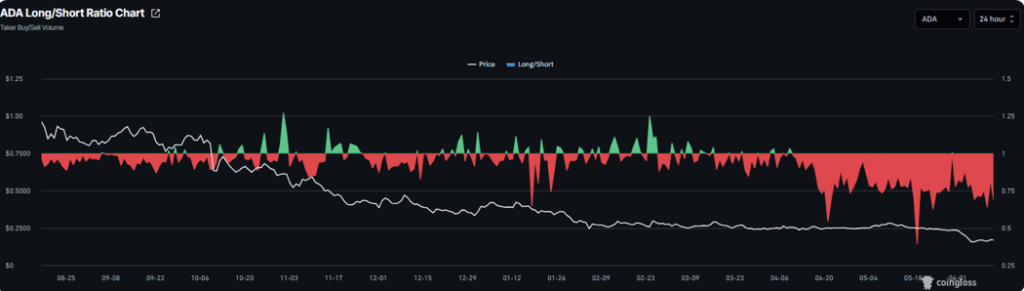
According to CoinGlass, Cardano’s long-to-short ratio sits at roughly 0.81, hovering near its lowest reading in more than a month. Since the ratio remains below 1.0, it suggests there are still more traders positioning for downside than upside. In simple terms, bearish bets continue to outweigh bullish ones.
At the same time, another important metric is telling a different story.
Cardano’s open interest-weighted funding rate has flipped back into positive territory, reaching around 0.0083%. Positive funding means long-position holders are paying shorts, a signal that bullish sentiment is beginning to return to parts of the market.
Taken together, these indicators don’t point to a clear trend. Instead, they reflect hesitation. Traders seem willing to cautiously test the bullish side, but conviction remains relatively weak.
Whale Activity Offers a Reason for Optimism
While derivatives traders remain undecided, some on-chain data is starting to look more encouraging.
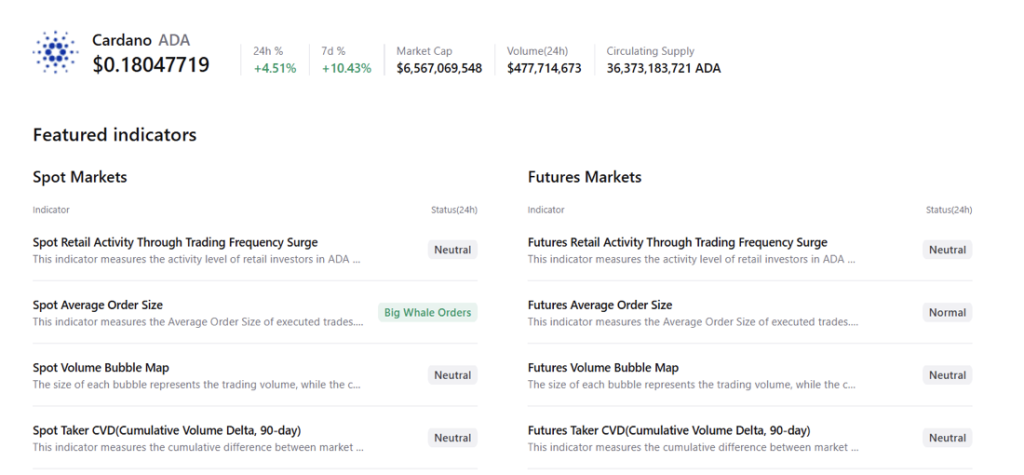
Recent figures from CryptoQuant suggest that large whale orders are appearing in Cardano’s spot markets. Interestingly, this buying activity is happening while many other metrics remain neutral, which could indicate that larger investors are quietly accumulating during a period of uncertainty.
Historically, whale accumulation has often preceded stronger price moves, although it doesn’t guarantee an immediate breakout. Still, when larger players begin stepping in while retail sentiment remains cautious, it tends to attract attention.
That doesn’t mean ADA is ready to explode higher tomorrow. But it does suggest that some investors see value at current levels, even if the broader market remains skeptical.
Technical Structure Still Favors Caution
Despite the recent rebound, Cardano’s larger chart structure remains challenging.
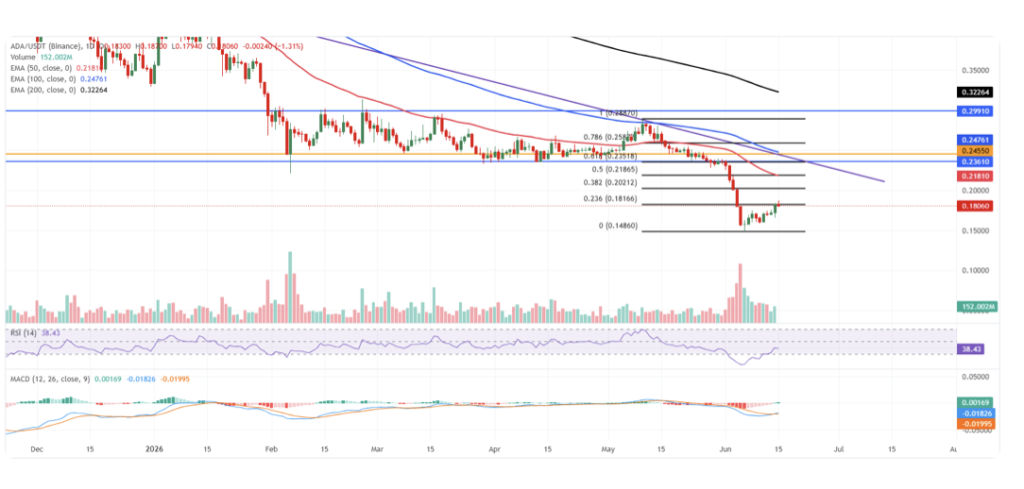
ADA continues to trade well below its major moving averages, including the 50-day EMA near $0.218, the 100-day EMA around $0.247, and the 200-day EMA near $0.322. As long as the price remains beneath these levels, the broader trend still favors the bears.
The current recovery also comes after a deep retracement that pushed ADA close to the lower end of its recent Fibonacci range. At the moment, the $0.148 area continues to serve as the most important structural support zone.
Momentum indicators, however, are showing subtle signs of improvement.
The Relative Strength Index sits near 38, which remains below neutral territory but is no longer deeply oversold. Meanwhile, the MACD has started turning slightly positive, hinting that bearish momentum may be weakening. That’s not the same thing as a confirmed trend reversal, but it does suggest the selling pressure is losing some of its intensity.
Key Levels Traders Are Watching
The first challenge for Cardano bulls sits almost directly overhead.
Initial resistance appears near the 23.6% Fibonacci retracement level around $0.181. Beyond that, traders are watching the $0.202 area, followed by the important $0.218 zone where both the 50% Fibonacci retracement and the 50-day EMA converge.
Above those levels, resistance becomes even heavier.
A dense supply area stretches between roughly $0.235 and $0.247, combining multiple technical barriers including the 61.8% Fibonacci level, previous horizontal resistance zones, a broken trendline, and the 100-day EMA. If ADA can eventually break through that cluster, higher targets around $0.258, $0.288, $0.299, and even the 200-day EMA near $0.322 could come into focus.
On the downside, the $0.148 support level remains critical. A loss of that area would likely shift sentiment back in favor of sellers and increase the risk of another leg lower.
Cardano Faces a Crucial Test
Cardano’s recent rebound has certainly improved the mood compared to a few weeks ago, but the market still lacks a clear consensus. Whale activity and positive funding rates provide reasons for cautious optimism, while the long-to-short ratio and broader technical structure continue to flash warning signs.
For now, ADA appears caught between recovery and resistance.
If buyers can continue building momentum and push through the key resistance zones ahead, Cardano may finally begin forming a stronger recovery trend. Until then, traders will likely remain cautious, watching closely for confirmation before committing to a larger directional move.