
- A new wallet opened a $2.27M 10× leveraged long position on Chainlink, signaling strong directional conviction.
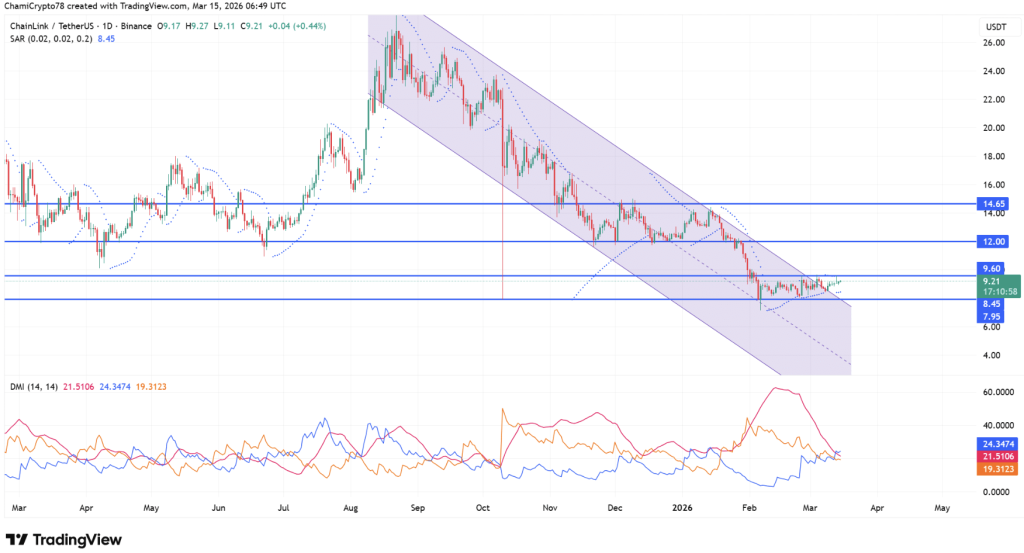
- LINK recently broke out of a descending channel and is now testing the $9.60 resistance level.
- Rising short liquidations and strong long positioning suggest bullish momentum may be building.
A brand-new wallet has quietly stepped into the spotlight after opening a massive 10× leveraged long position on Chainlink’s LINK token. The trade involves roughly 251,798 LINK, valued at about $2.27 million, and it didn’t take long before derivatives traders started noticing it.
What really stands out is the liquidation level sitting around $6.5547. That margin suggests the trader expects LINK to remain comfortably above major downside risk zones, at least in the near term. Positions like this don’t usually appear randomly… they tend to signal conviction that a directional move could be coming.
The size of the position also hints at something more calculated than a casual speculative bet. Naturally, trades like this tend to ripple through sentiment across the market. Investors are now watching closely, wondering if deeper capital—perhaps institutional-style positioning—is slowly returning to the Chainlink ecosystem.
Chainlink Breaks Out of Long-Term Downtrend
From a technical standpoint, Chainlink has just pushed out of a descending channel that had been shaping price action for months. That breakout marks a noticeable structural shift after a prolonged stretch of downward pressure and sideways consolidation.
Right now the market’s attention is drifting toward the $9.60 resistance area, which represents the next real test for buyers. LINK has been hovering around the $9 mark recently, stabilizing after the breakout and showing early hints that momentum might be turning.
The broader chart is also beginning to show a subtle but encouraging pattern—higher lows forming around the $8.45 level. That kind of structure usually strengthens nearby support zones. If price manages to hold above the breakout region, analysts believe the next upside targets could extend toward $12.00, with a more ambitious continuation potentially reaching the $14.65 resistance area.
Still, confirmation matters. Breakouts can fade if buying pressure doesn’t follow through.
Momentum Indicators Begin Shifting in Favor of Buyers
Momentum indicators are starting to reflect this change in market tone. The Directional Movement Index now shows the +DI hovering around 24.3 while the –DI sits closer to 19.3, a signal that buyers are gradually gaining the upper hand.
At the same time, the ADX indicator sits near 21.5. That level doesn’t indicate a powerful trend just yet, but it does suggest that directional pressure may be building slowly underneath the surface.
Another small but interesting detail comes from the Parabolic SAR indicator. Its dots recently flipped below the price, which often appears during early trend reversals or recovery phases. Taken together, these signals suggest the market might be shifting out of its earlier bearish structure… though the move is still in its early stages.
Binance Traders Heavily Tilt Toward Long Positions
Derivatives positioning data paints an equally interesting picture. According to CoinGlass, roughly 71.2% of Binance’s top trader accounts were holding long positions on LINK at the time of reporting, while only 28.8% remained short.
That creates a Long/Short ratio of around 2.47, showing a strong preference toward bullish exposure among experienced participants. When large traders cluster on one side of the market like this, it usually reflects confidence in price stability or an expected recovery phase.
However, heavy long positioning can sometimes create its own risks. If too many traders pile into the same trade, sudden volatility can trigger sharp unwinds. Markets rarely move in a straight line, after all.
Rising Short Liquidations Add Fuel to the Upside
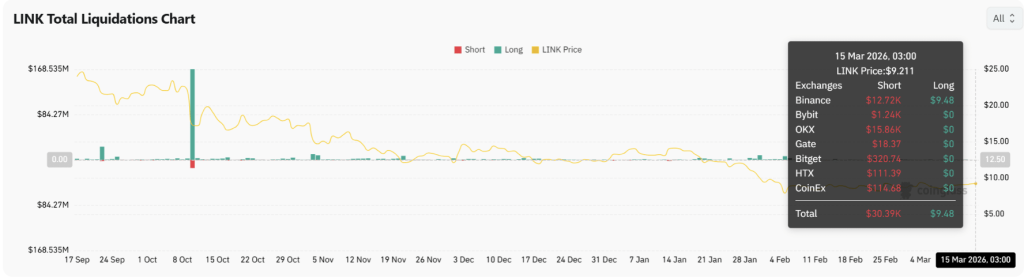
Recent liquidation data shows that bearish traders have already started feeling pressure as the price climbed. Short liquidations have noticeably outpaced long liquidations during the latest move upward.
Data shows about $30.39K in short positions were forced out of the market, compared to roughly $9.48K in long liquidations. When short sellers get squeezed, they’re forced to buy back the asset to close their positions—which can accelerate upward price movement.
That dynamic adds an extra layer of momentum during recovery phases. Combined with the breakout structure, the growing long bias among traders, and the notable $2.27 million leveraged position, the broader picture suggests bullish pressure may be quietly building.
For now, the key levels remain clear. As long as LINK holds above the $9 support zone while attempting to push through the $9.60 resistance level, the path toward a larger recovery stays open. The real test, though, will be whether buyers can reclaim higher resistance zones and sustain momentum beyond this early breakout phase.