
- SHIB fell 11.5% weekly as whale selling and memecoin weakness kept pressure high
- Friday’s BTC-led relief rally pushed SHIB up 22%, but daily structure remains bearish
- Key resistance zones sit at $0.00000758, $0.00000817, and $0.000009, favoring sell-the-bounce setups
Shiba Inu has been taking a beating lately, and it’s not just the usual memecoin chop either. SHIB has been under heavy bearish pressure, and according to recent market observations, whales and large holders have continued offloading into weakness. Over the past week, Shiba Inu dropped around 11.49%, lining up closely with the broader memecoin sector, which fell roughly 13.5% over the same stretch.
Then Friday happened.
Bitcoin printed a sizeable relief bounce on February 6, rallying about 19% in a single move. That rebound pulled SHIB higher too, sending it up roughly 22.46% on the day. The bounce was fast and aggressive, the kind that makes people think “okay, maybe the bottom is in.”
But at press time, the longer-term trend still looked bearish. And that’s the key part traders can’t ignore.
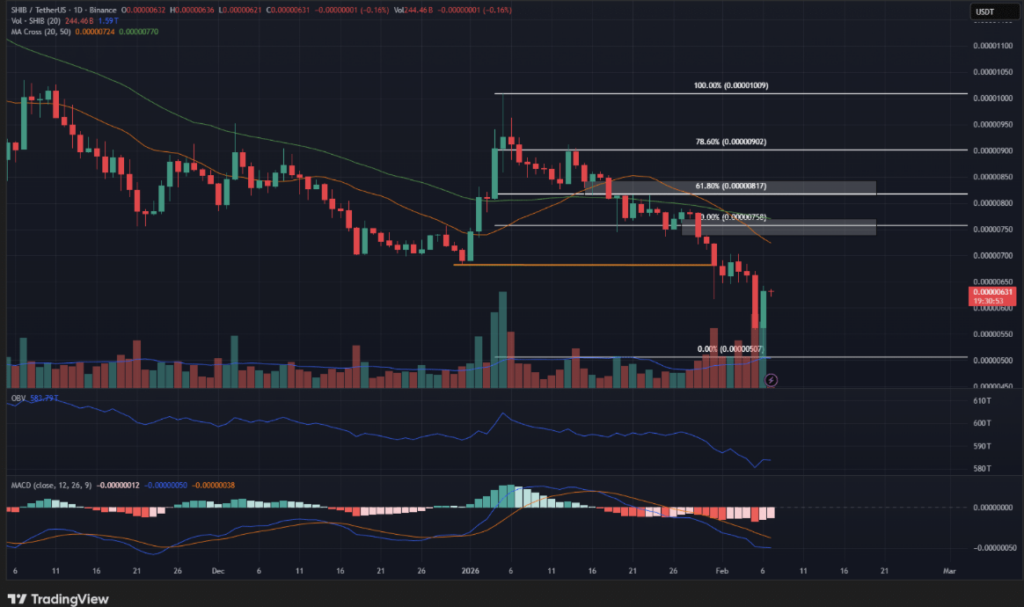
SHIB daily chart shows the bounce may be a pullback, not a reversal
On the 1-day timeframe, Shiba Inu’s structure and momentum remain firmly bearish. Price has printed a fresh swing low, and the bounce over the past few hours looks more like the start of a pullback rather than a clean reversal.
Momentum indicators aren’t giving bulls much help either. The MACD hasn’t recorded a bullish crossover and remains deep in bearish territory, which reflects just how heavy the recent downside has been. In other words, the market may be bouncing, but the trend hasn’t changed.
Using the most recent swing move lower, Fibonacci retracement levels highlight three key resistance zones that matter most if SHIB continues to rebound:
$0.00000758
$0.00000817
$0.000009
The first two levels are especially important because they also line up with daily imbalances. Those imbalances can act like supply zones, meaning price often gets rejected there as sellers step back in. So even if SHIB keeps climbing, the market is likely to run into overhead resistance fairly quickly.
Given the wider market sentiment and the ongoing whale distribution, traders may view bounces into these retracement zones as selling opportunities, not “breakout” signals.
The bullish case exists, but it’s still the less likely path
There is a bullish argument, even if it’s not the one most charts are leaning toward right now. Bitcoin recently fell around 38% in just 22 days, measured from January 15 to the most recent low. After drops like that, BTC often rebounds harder than people expect, especially if short liquidations start acting like a magnet.
If Bitcoin continues pushing higher beyond the $71K region, that strength could spill over into memecoins again, including SHIB. In a stronger relief rally scenario, Shiba Inu could potentially run all the way back toward the daily swing high near $0.00001.
But realistically, that outcome would require sustained momentum across the market, not just a one-day bounce. And at the moment, the structure still looks like the market is in recovery mode, not a fresh uptrend.
Traders’ call to action: sell the bounce
The higher timeframe trend is still the main problem for SHIB bulls. The weekly chart has been in a bearish structure since June 2025, and the daily timeframe is bearish as well. That means any bounce is still happening inside a downtrend, and those are usually the rallies that get sold.
For traders, the cleanest setup is simple. If SHIB rallies into the Fibonacci retracement levels and the daily imbalances overhead, those zones can be used as areas to sell into strength. It’s not glamorous, but in a bearish market, that’s often the higher-probability play.
SHIB may bounce, and it may even bounce hard. But until structure flips and whales stop distributing, the trend remains bearish, and rallies are likely to fade.