
- LINK dropped nearly 13% in 24 hours, but trading volume surged 76% to $2B
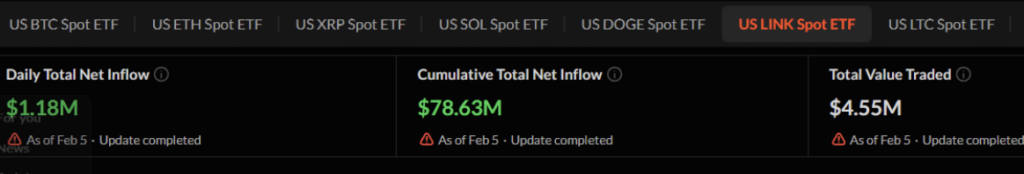
- Spot LINK ETFs recorded $1.18M in inflows, signaling accumulation despite bearish sentiment
- $7.20 is now the key support level, with $5.85 as the next downside target if it breaks
Chainlink has been getting hit like everything else lately, but what’s interesting is how much attention it’s pulling in while the chart looks ugly. Investor interest in LINK has surged over the past few days, even as the broader crypto market flipped sharply risk-off and dragged most assets lower.
LINK hasn’t been spared. It’s lost several key support levels and at press time was down 12.75% over the past 24 hours, trading near $8.01. But at the same time, participation jumped hard, with trading volume surging 76% to roughly $2.02 billion.
Normally, rising volume during a price decline screams fear. It suggests traders are leaning into the bearish trend, not fighting it. But when you zoom in on what investors are actually doing, the picture gets a little weird, and not in a bad way.
ETF inflows suggest accumulation is happening under the surface
While price was dumping, U.S. spot LINK ETFs quietly recorded fresh inflows. On February 5, 2026, SoSoValue reported that spot Chainlink ETFs saw $1.18 million in net inflows. It’s not a massive number compared to Bitcoin ETFs, sure, but the direction matters more than the size.
In simple terms, Wall Street investors were adding exposure to LINK while the market was bleeding. That’s not what you expect to see during a sharp drawdown, and it hints that some buyers are treating this drop as a value zone, not a reason to run away.
This doesn’t guarantee a bottom. But it does show that not everyone is panicking.
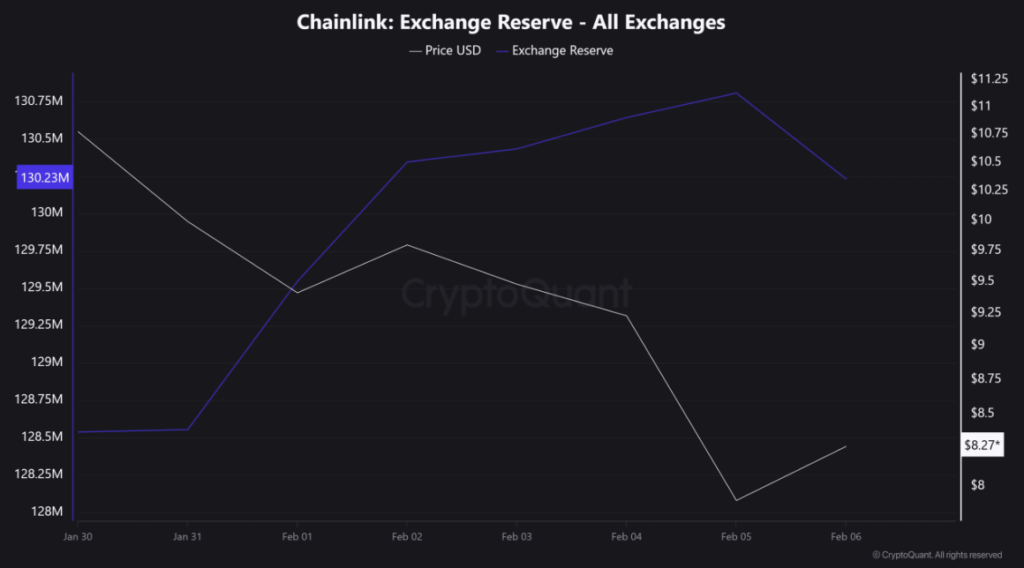
Exchange reserves drop as LINK moves off exchanges
On top of ETF activity, exchange reserve data is also leaning toward accumulation. According to CryptoQuant, Chainlink’s total exchange reserves dropped over the past 24 hours from 130,807,419 LINK to 130,270,399 LINK. That’s a decline of about 537,020 LINK, which is not small.
When exchange reserves fall, it often means tokens are being moved off exchanges and into private wallets. And usually, people don’t withdraw coins because they plan to sell them immediately. It’s often a sign of longer-term positioning, or at least reduced sell pressure in the short run.
So while traders are clearly selling, there’s also a steady undercurrent of buyers quietly taking supply off the market. That’s the kind of divergence that tends to matter later.
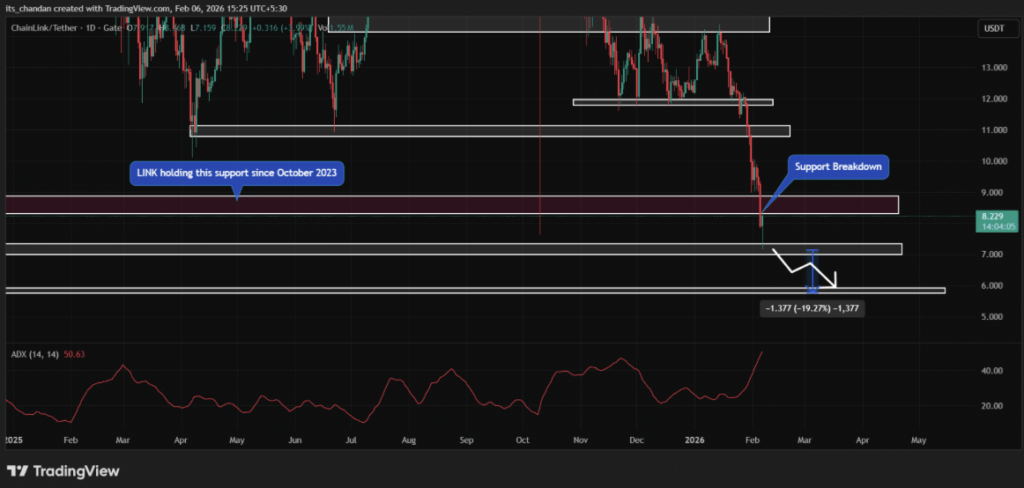
LINK breaks a key long-term support, but $7.20 is now the main line
From a technical standpoint, LINK’s daily chart shows that the recent decline broke below the long-standing $8.35 support level. This was a major line that had held since October 2023, and losing it shifts the structure bearish. When a support like that breaks, it usually flips into resistance, meaning any bounce back toward it may get sold.
During the drop, LINK also tested another support zone near $7.20. This level matters because it previously acted as a long consolidation area before LINK eventually broke out above $8.35 back in 2023. In other words, $7.20 is not just “a level,” it’s a historically proven demand zone.
If LINK can hold above $7.20 and later reclaim $8.35, a reversal setup starts to form. But if $7.20 fails, downside momentum could extend further, with analysts pointing toward a potential move down to $5.85, roughly another 20% lower.
ADX shows the trend is strong, and that’s a warning
One reason this move feels so aggressive is because trend strength is elevated. The Average Directional Index, which measures how strong a trend is, reached around 50.63. Anything above 25 is considered strong, so 50+ suggests LINK is currently in a powerful directional move.
The catch is that ADX doesn’t tell you whether the trend is up or down, it just tells you it’s strong. And right now, the strong trend is clearly bearish. That’s why even if LINK is oversold, rebounds can still be short-lived and choppy.
Derivatives traders are leaning bearish, and the imbalance is clear
In the derivatives market, intraday traders appear to be following the trend rather than betting against it. CoinGlass’ LINK Exchange Liquidation Map shows heavy positioning around $7.91 on the downside and $8.42 on the upside.
At these levels, traders have built roughly $1.44 million in leveraged long positions versus about $4.32 million in leveraged shorts. That imbalance is pretty telling. It reflects bearish sentiment and shows that traders are more confident betting against LINK than trying to front-run a bounce.
Chainlink is being sold, but it’s also being accumulated
So that’s the situation. LINK is under pressure, key support has been lost, and derivatives traders are leaning bearish. But at the same time, ETF inflows are positive and exchange reserves are dropping, suggesting accumulation is happening underneath the chaos.
LINK isn’t out of danger yet. The $7.20 zone is the main line in the sand. But if it holds, the current sell-off may end up looking like a shakeout, not the start of a long collapse.