- Cardano is trading near $0.25–$0.27, a major support zone from prior bear market lows
- Weekly RSI is deeply oversold, suggesting downside momentum may begin compressing
- A weekly close below $0.24 risks opening a move toward $0.115 and potentially $0.053
Cardano is back at one of those levels that traders remember, even if they don’t want to. After a prolonged downtrend and repeated failures to reclaim higher resistance zones, ADA is now trading around the $0.25 to $0.27 area, according to Brave New Coin pricing. This zone isn’t just another random number on the chart either. It lines up with levels that marked the depth of the last bear market, which is why the market is watching it so closely.
At this point, Cardano price action is less about momentum and more about location. ADA has drifted back into a historically significant support region, and when an asset returns to these kinds of levels, the next move tends to matter more than usual. It’s where longer-term participants either step in, or step away.
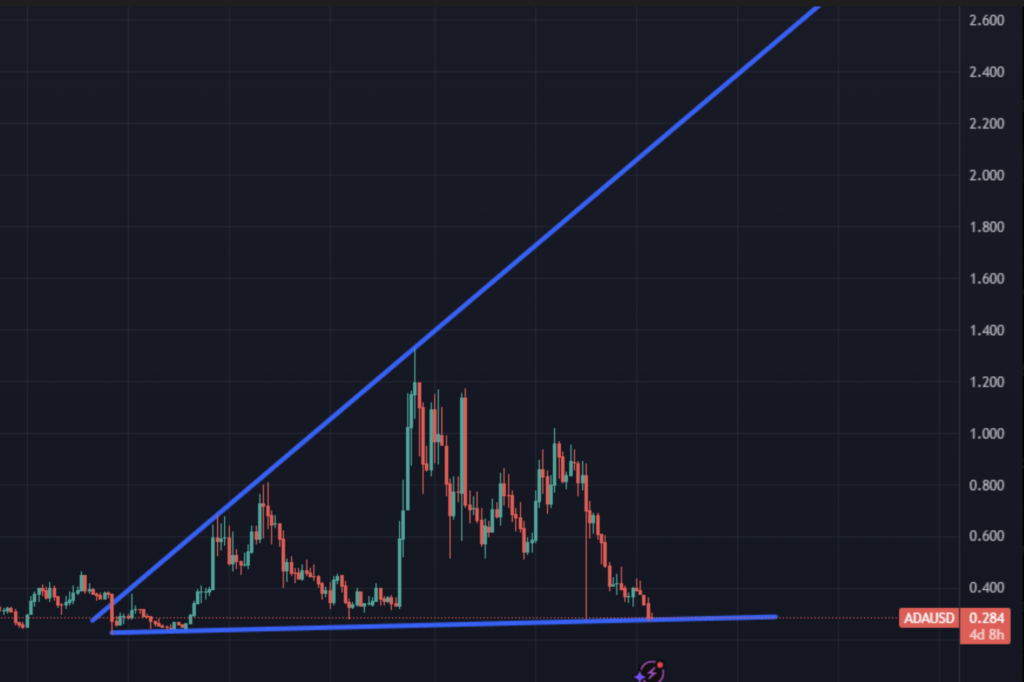
Weekly chart shows multi-year trendline support under stress
On the weekly timeframe, ADA is pressing into a multi-year trendline support zone that traces back to the 2022 bear market lows. This support sits broadly between $0.24 and $0.27, and price is currently hovering just above it. That makes it a structurally important decision area, not the kind of zone you casually ignore.
A longer-term scenario shared by Sssebi frames this region as a potential pivot if 2026 turns into a more constructive year for crypto overall. The chart doesn’t imply immediate upside, but it does suggest that downside momentum may begin compressing, as long as ADA holds $0.24 on a weekly closing basis. If it loses that level, the chart opens up into much deeper historical supports, and those aren’t pretty.
Below the current band, the next major support levels come in around $0.115 and $0.053. These are levels that were highlighted during prior cycle lows, and they represent what a true capitulation scenario could look like if the market breaks down further.
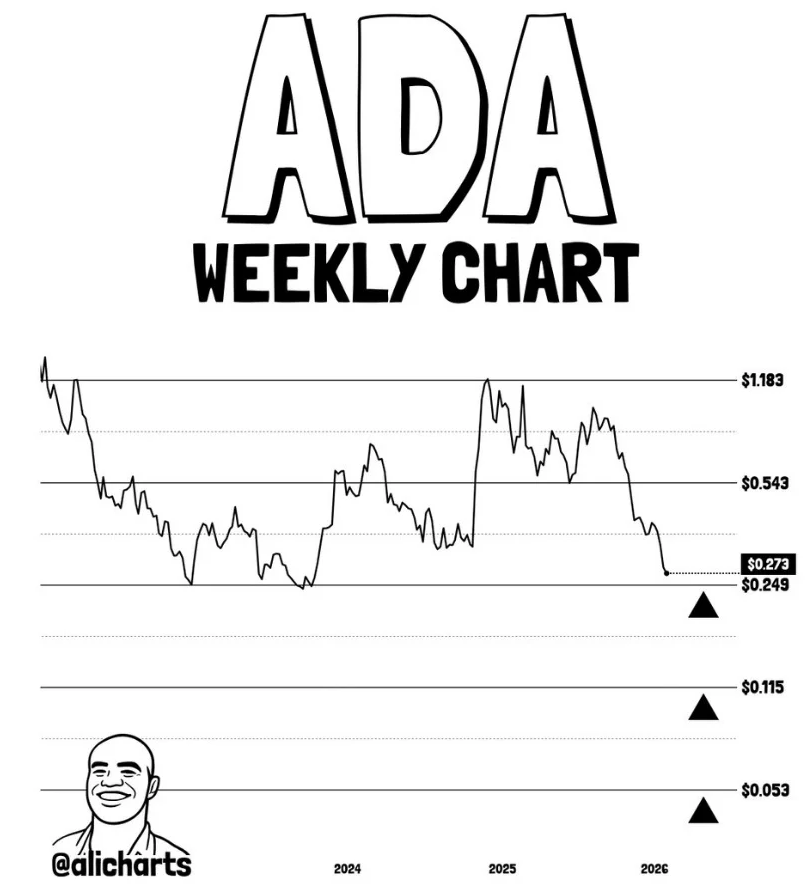
Key Cardano support levels traders are watching
A separate weekly chart shared by Ali Charts highlights three major support zones that matter most from here. The first is $0.249, which is basically the current area of interaction and immediate support. If ADA can hold here, it keeps the structure alive.
If that fails, the next historical demand zone sits around $0.115. And if the market enters a deeper washout, the extreme downside support level near $0.053 comes into focus, which ties back to prior cycle capitulation.
The repeated retests around $0.25 also carry a warning. Support zones tend to weaken the more they are tested. Each bounce can remove buyers from the level, and eventually the floor stops being a floor. That’s why this region feels so tense right now, it’s important, but it’s also been used up.
Weekly RSI turns deeply oversold, but reversals aren’t automatic
Momentum indicators add another layer. On the weekly chart, ADA’s RSI has slipped into deeply oversold territory, and some analysts have noted that Cardano has rarely been this oversold on a weekly basis in its entire trading history. That’s not a bullish signal by itself, but it does suggest selling pressure is becoming less efficient.
Oversold conditions don’t guarantee a reversal. Markets can stay oversold longer than people expect, especially in risk-off environments. But historically, these kinds of readings often line up with periods where downside follow-through starts weakening. Even if price doesn’t rally immediately, the market may shift into a slower base-building phase instead of continuing straight down.
Sentiment remains fragile as risk-reward starts to shift
Even with the technical importance of this zone, sentiment around ADA is still shaky. Volume has tapered off, participation is down, and risk appetite across altcoins remains selective. In this environment, false signals are common, and long consolidations can drag on longer than anyone wants.
That said, Cardano is no longer trading in technical no-man’s land. From a structural perspective, ADA is sitting at levels where longer-term participants usually reassess downside risk rather than chase weakness. It’s a zone that naturally attracts attention, not because it guarantees upside, but because the risk-reward profile changes.
Where Cardano goes next depends on one level
Cardano’s price outlook now revolves around whether the $0.25 to $0.27 zone can hold. If it does, ADA could stabilize and begin building a base, with any recovery attempt likely needing to reclaim $0.32 to $0.35 first. Above that, heavier resistance sits near $0.54, where prior range supply remains.
If ADA breaks down and closes below $0.24 on the weekly chart, the structure weakens materially. In that case, focus shifts toward $0.115, followed by the deeper cycle support near $0.053. It’s a simple setup, but not an easy one, because the market is sitting right at the edge of a long-term decision point.