
- Solana surged 21% earlier in the week but failed to sustain gains and returned to range lows.
- Falling Open Interest, negative funding rates, and rising Coin Days Destroyed signal persistent selling pressure.
- The weekly structure remains bearish, with a potential downside target near $47 if support breaks.
Solana ripped higher earlier this week, jumping from $75.6 to $92.1 in roughly 32 hours. A 21% move like that usually shifts sentiment fast. For a moment, it looked like momentum had finally cracked the February slump. But just as quickly, the rally cooled.
The problem? SOL has been stuck in a range for most of the month. And after briefly pushing above the range highs, price slipped right back down toward the lower boundary. Breakout attempts that fail tend to leave a mark.
Sentiment Turns Heavy Again
Broader market conditions didn’t help. Bitcoin’s sell-off triggered a wave of fear across crypto, amplified by macro concerns and even geopolitical escalation headlines. Panic selling returned, and risk appetite thinned out.
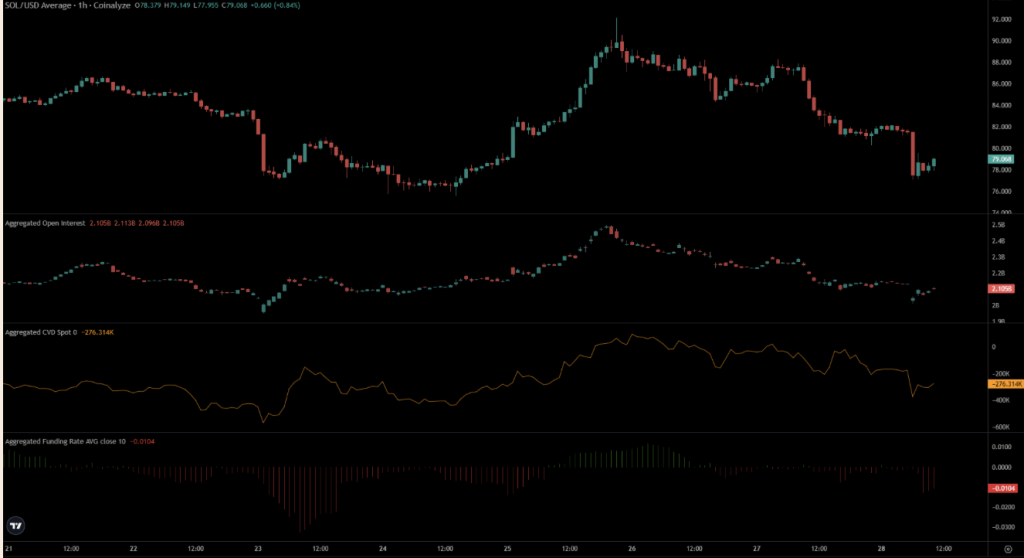
In derivatives markets, Open Interest declined while funding rates flipped negative. That combination usually signals bearish positioning — traders leaning short or stepping away altogether. Spot CVD also trended lower, reinforcing the idea that real selling pressure was building, not just leverage noise.
In short, buyers lost control of the short-term narrative.
Sellers Have Been Active All Month
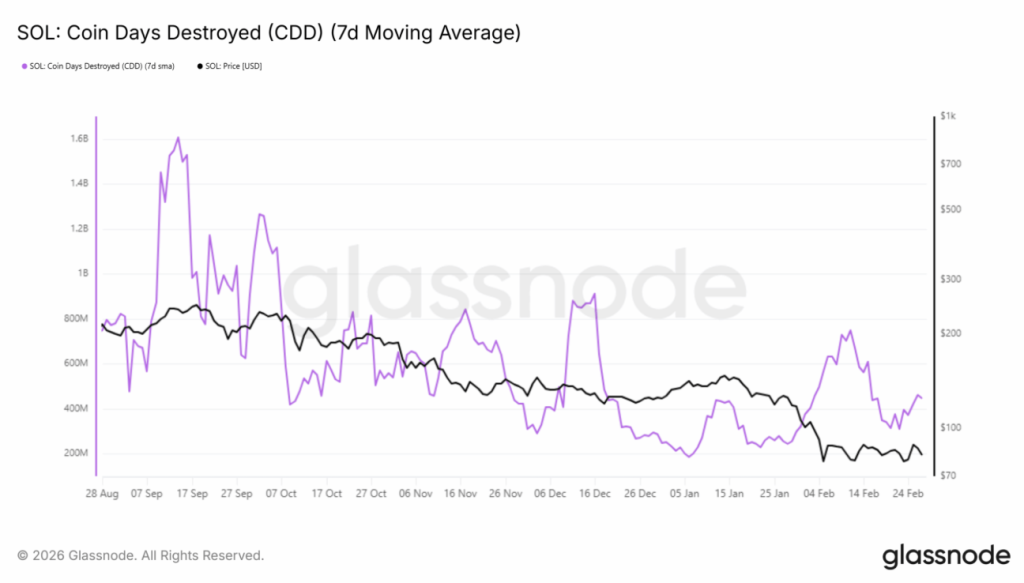
On-chain data supports that tone. Solana’s Coin Days Destroyed metric ticked higher at the start of February. While it wasn’t as dramatic as the spike seen during the $128 to $67 collapse, it still indicated that older coins were moving.
That’s often a quiet warning sign. Long-term holders tend to distribute into strength. And each bounce throughout February has seemingly offered exit liquidity to those looking to reduce exposure.
The 4-hour chart adds more nuance. Yes, price is near the local range floor. The CMF sits slightly positive at +0.06, hinting at mild capital inflows. The MFI has dipped into oversold territory. On the surface, that could tempt swing traders to anticipate a bounce.
But context matters. A range inside a larger bearish structure doesn’t automatically mean accumulation. Sometimes it’s just pause-before-continuation.
Bigger Picture Remains Bearish
Zooming out to the weekly chart paints a clearer picture. The March 2025 swing low at $95 has been decisively broken. That level previously acted as structural support. Losing it shifts the broader trend bearish.
Fibonacci extension levels now point toward a potential long-term target near $47.93. That doesn’t mean price must go there immediately. But it frames the risk.
For traders, the cautious approach may be to expect a breakdown below the short-term range rather than a breakout above it. A retest of range lows as resistance could offer confirmation for bearish continuation. Meanwhile, Bitcoin’s ability to defend $64k and reclaim $66k could serve as an early signal of shifting momentum.
Until that happens, SOL’s rallies might continue to face heavy supply. The bounce was strong. The structure, less so.