
- Solana has rebounded from its $95.87 low, with capital flow data hinting at accumulation
- Long-term holders remain patient, while short-term traders are increasing activity
- The $120 level remains the key test that will decide whether this recovery can extend
Solana has started to steady itself after a brutal market-wide crash that wiped out a large chunk of recent gains. Over the past seven days, SOL is still down roughly 15.5%, with most of that damage concentrated during the aggressive sell-off between January 31 and February 1. At the worst point of the move, price slipped to $95.87 before finally finding buyers willing to step in.
Since that low, Solana has rebounded close to 8% and is now hovering around the $103 area. That bounce has already erased most of the daily losses from the drop, which is notable given how fast sentiment shifted just days ago. More importantly, the rebound hasn’t looked completely hollow, as capital flow data and long-term holder behavior are starting to lean more constructive, though risks haven’t disappeared yet.
Breakdown target hit as buyers quietly step in
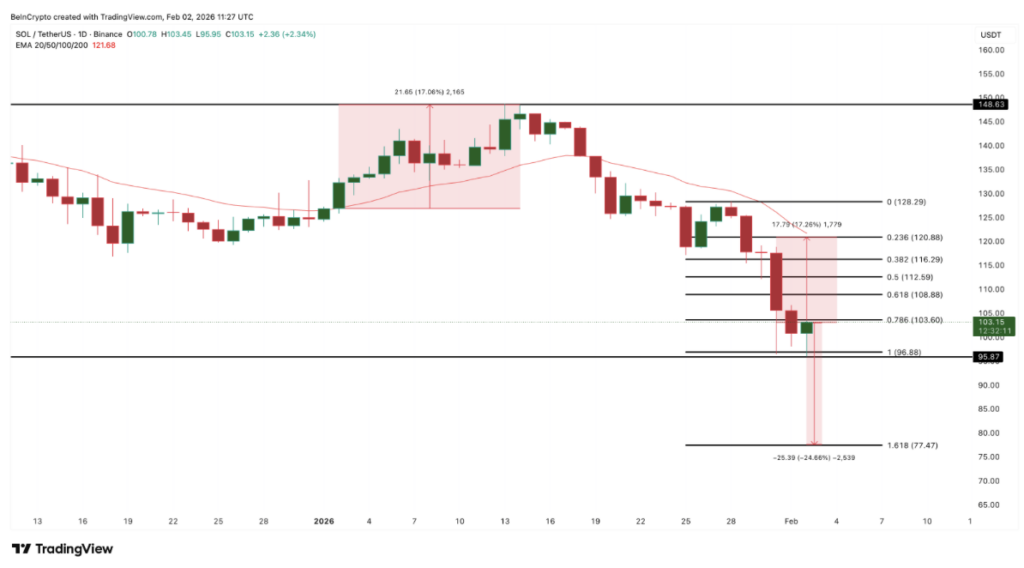
Technically, Solana’s decline followed a fairly clean pattern. On the daily chart, SOL completed a head-and-shoulders breakdown in late January, with the projected downside target sitting right around the $95 to $96 zone. That target was tagged almost perfectly when price hit $95.87, which often marks an area where selling pressure begins to cool.
After reaching that level, the pace of selling slowed, and buyers began to show themselves. This shift is visible in the Chaikin Money Flow, which tracks whether capital is entering or leaving an asset based on price and volume. While SOL continued to trend lower between January 27 and February 3, CMF actually moved higher, creating a bullish divergence that hinted at accumulation beneath the surface.
This kind of behavior is uncommon during sharp corrections. Normally, CMF collapses alongside price, but in this case, rising CMF suggested that larger players viewed the $95–$96 area as attractive. CMF is now drifting back toward the zero line, and a move above it would confirm that buying pressure is starting to outweigh selling, strengthening the rebound narrative.
Long-term holders stay calm as short-term traders increase activity
Strong recoveries usually need support from long-term holders, and Solana appears to have that, at least for now. Liveliness data, which tracks how often long-held coins are being spent, has been trending lower over the past month. Even during the sharp slide from $127 to below $100, liveliness failed to spike in any meaningful way.
Aside from a brief uptick around January 29 and 30, long-term holders largely stayed put, suggesting they viewed the move as a temporary shakeout rather than a deeper structural issue. That patience helps stabilize price during volatile periods, but it doesn’t tell the full story.
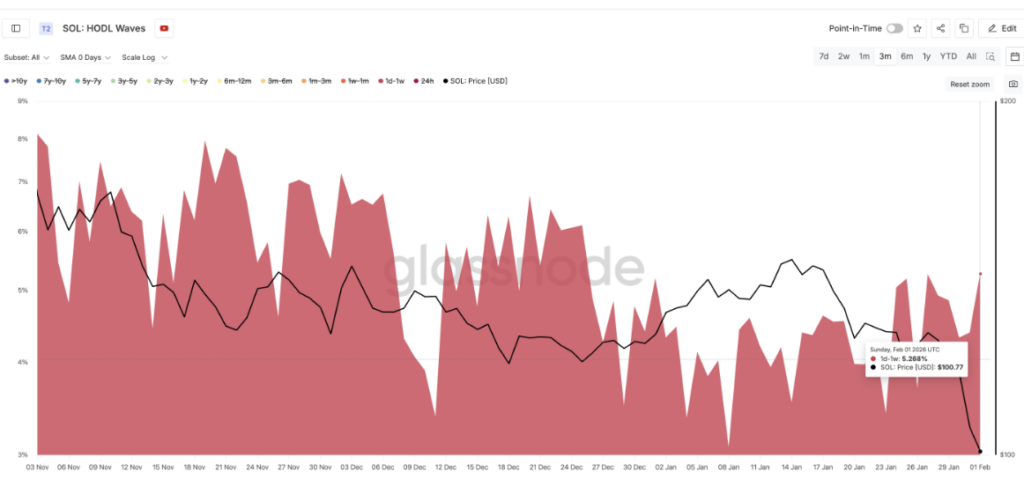
HODL Waves data shows that the 1-day to 1-week cohort has been growing, rising from roughly 4.38% to 5.26% between late December and early February. This group represents short-term traders who tend to buy dips and sell quickly into rebounds. Their increased presence adds volatility and raises the risk that rallies fade faster than expected if stronger demand doesn’t step in.
Key Solana price levels and why $120 still matters most
With momentum improving but uncertainty still hanging over the market, price levels matter more than indicators right now. The $95.87 to $96.88 zone remains the most important support to watch. As long as SOL holds above this area, the rebound structure remains valid, but a clean break below it would reopen downside risk toward the $77 region.
On the upside, Solana is currently testing resistance near $103.60. A sustained daily close above this level would signal short-term strength, but it isn’t the real test. That level sits higher, near $120.88, and it carries heavy technical weight.
This zone marks a major breakdown point from January 29, lines up closely with the 20-day EMA, and previously acted as a launchpad for a 17% rally earlier in January. A daily close back above $120.88 would suggest that momentum is shifting decisively back to buyers and that the correction phase may be ending. Above it, resistance near $128 and potentially $148 could come into play, though that upside depends heavily on continued capital inflows rather than short-term trading noise.