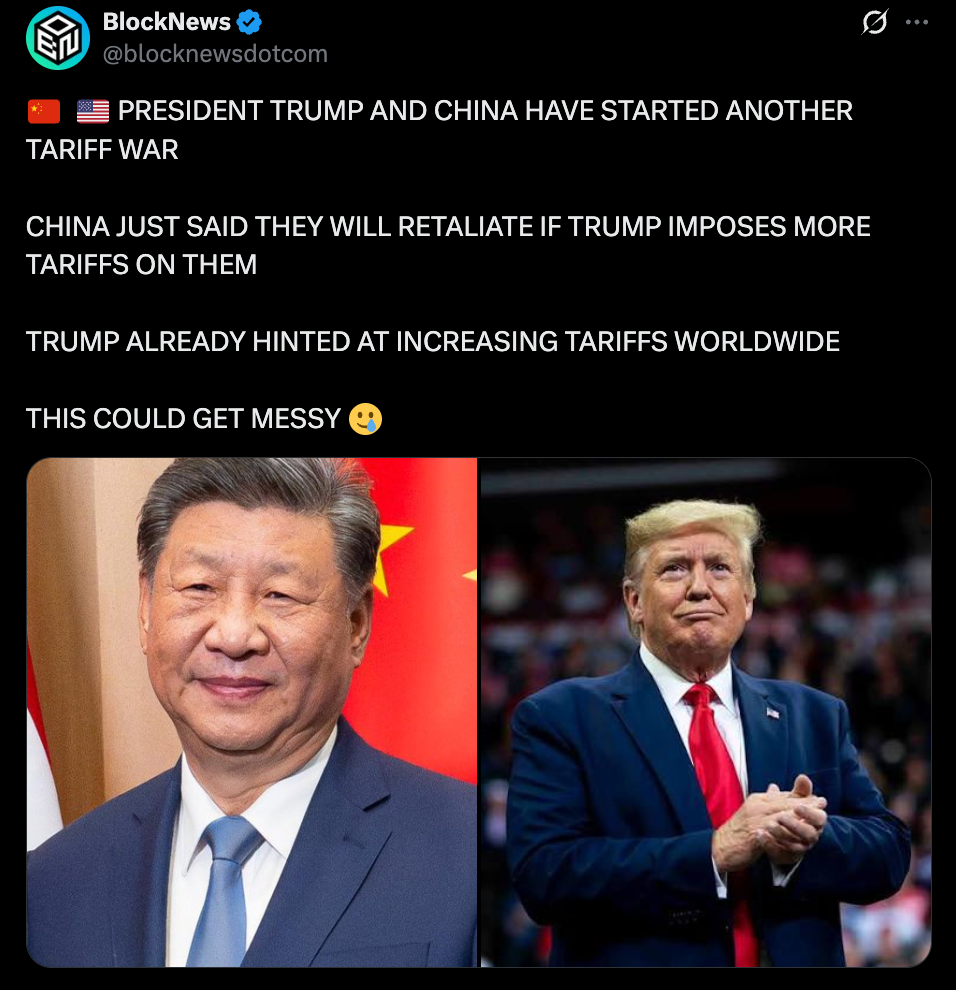
- China vows retaliation if the U.S. revives tariffs through a Phase One probe
- Trump-era tariff tools remain partially intact despite court limits
- Trade tension is escalating through positioning, not immediate breakdown
China’s statement that it will take “all necessary measures” if new U.S. tariffs are imposed is less about trade flows and more about leverage. The trigger is a potential Phase One compliance investigation, which could reopen the legal pathway for targeted tariffs.
This follows recent court rulings that narrowed emergency tariff authority used during Trump’s first term. A compliance-based probe would offer Washington an alternative route. Beijing is signaling early that it will not accept tariffs framed as enforcement without response.
Phase One Has Become Political Currency
The original Phase One deal centered on agricultural purchases, intellectual property commitments, and trade balances. Today, it functions more as a narrative tool. China argues it fulfilled obligations under extraordinary pandemic conditions, while U.S. export controls and investment restrictions altered the spirit of the agreement.
Whether those claims hold in legal terms is secondary. Both sides are shaping perception before negotiations resume. Being seen as the reasonable actor matters as much as actual trade metrics.
Timing Ahead of High-Level Talks
The escalation arrives weeks before a high-profile visit to Beijing. That timing is strategic. By drawing boundaries now, China frames any future tariff escalation as a deliberate U.S. choice rather than a breakdown in diplomacy.
Although Supreme Court decisions have limited certain tariff authorities, Section 301 remains a viable mechanism. Beijing’s warning suggests that invoking it again would carry countermeasures.
Markets Cannot Ignore the Friction
Even without immediate tariff hikes, uncertainty alone affects markets. Supply chain planning, corporate pricing models, and inflation expectations react to trade risk. Investors may not see an outright rupture, but sustained friction can dampen growth assumptions.
This dynamic influences equities, commodities, and currency flows. Markets tend to price tension long before policy becomes formal.
A Strategic Standoff
The current exchange is not about soybeans or intellectual property alone. It is about leverage heading into an election year. Neither side wants to appear weak, and neither wants to escalate beyond control.
Trade disputes rarely hinge on a single announcement. They unfold through positioning. At this stage, both Washington and Beijing are signaling resolve rather than retreat.