- HBAR is consolidating near $0.117 after slipping below short-term resistance
- Momentum indicators show easing sell pressure, but conviction remains weak
- Holding $0.115 support is key to avoiding a deeper pullback toward $0.103
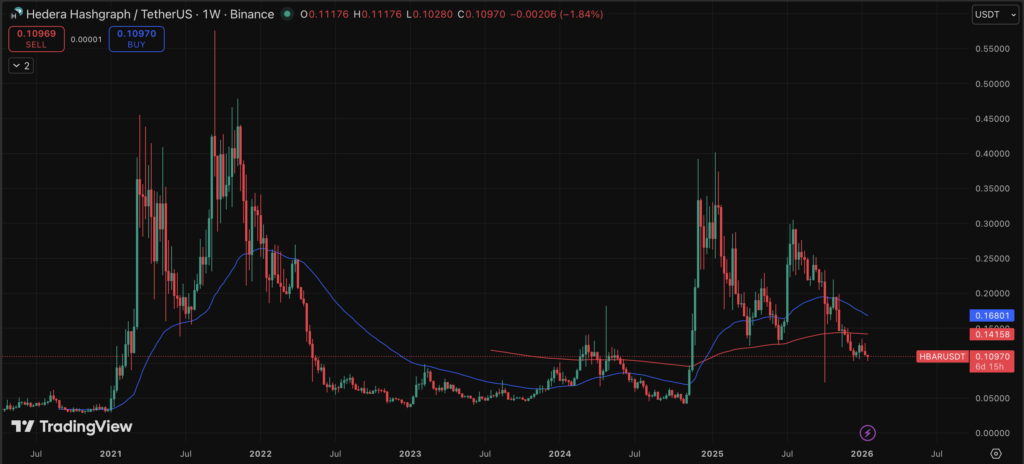
Hedera is starting the week trading around $0.1171, and on the surface, it doesn’t look like much is happening. No big candles, no dramatic headlines. But this is one of those moments on the chart that tends to matter more than it first appears.
HBAR isn’t rallying, and it isn’t collapsing either. Instead, it’s hovering around levels that often act as decision points. That’s exactly why this zone deserves attention, especially for traders who follow HBAR’s price action closely. These quiet stretches often come right before clarity shows up.
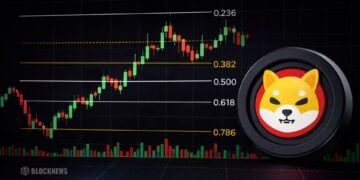
HBAR Slips Back Below Short-Term Resistance
On the 4-hour chart, HBAR recently dropped back below its 7-day moving average near $0.119. That level had been acting as short-term support, and once it failed, price drifted lower instead of snapping back. It’s not a sharp move, but it does show sellers are still active whenever HBAR tries to push higher.
The Fibonacci levels tell a similar story. Price dipped toward the 78.6% retracement around $0.11, a level that’s shown up as a reaction zone during previous pullbacks. Buyers did step in there, but the bounce so far has been restrained. There’s no urgency, no aggressive follow-through, just a slow attempt to stabilize.
Momentum Improves, But Conviction Is Missing
Momentum indicators reflect that same cautious tone. The MACD histogram has turned positive, which usually suggests selling pressure is easing. That’s a constructive sign, even if it’s subtle.
The issue is that the MACD line itself remains below the signal line. When that happens, price often chops sideways instead of trending. It’s a pause, not a push. RSI is sitting around 47, right in the middle of the range. That tells us HBAR isn’t overbought or oversold. There’s room for a move, but nothing is forcing it yet.
Support Is Holding, Barely
For now, $0.115 is doing most of the work. As long as HBAR stays above this level, the structure remains intact. It’s not strong, but it’s holding together.
A clean break below $0.115 could shift sentiment quickly and put the $0.103 area back on the radar, which lines up with last year’s lows. That’s where downside risk would start to feel more real.
On the flip side, if buyers can defend support and reclaim the $0.119 to $0.120 zone with more authority, the tone improves. That would suggest the pullback is losing steam and another attempt higher could follow, even if it’s gradual.
So, Where Does HBAR Go From Here?
Right now, HBAR is stuck in a waiting phase. The structure isn’t broken, but it’s not convincing either. For this HBAR price setup to turn clearly bullish, price needs to hold support and push back above resistance with more intent.
Until then, sideways movement with a slight bearish tilt remains the most likely outcome. How HBAR behaves around these levels over the next few sessions should give a much clearer signal about what comes next.