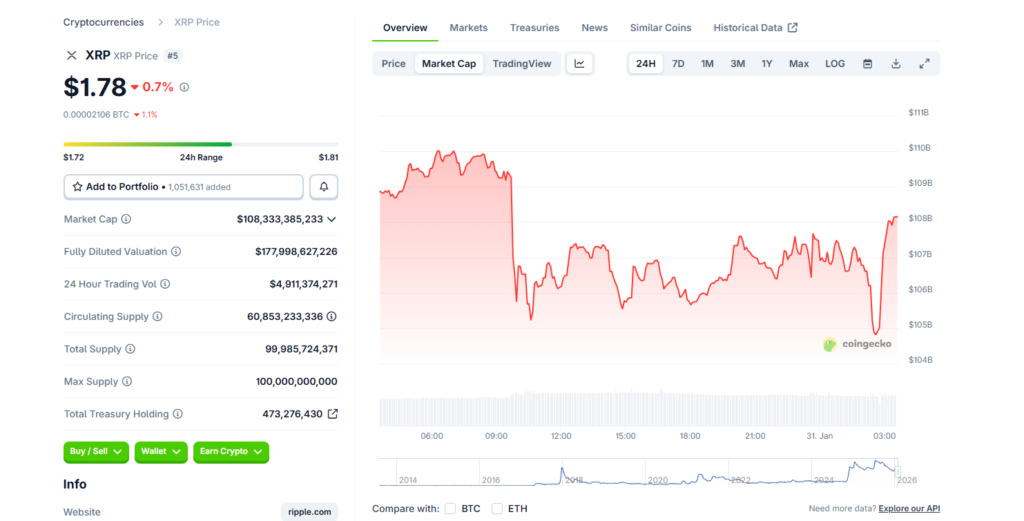
- XRP is down sharply in early 2026 as the broader crypto market turns risk-off
- Bitcoin’s drop toward $82,000 is dragging altcoins lower, including XRP
- Analysts see downside risk, but a full breakdown below $1 is not yet the base case
2026 is shaping up as a mirror image of last year for XRP. After breaking a multi-year ceiling and surging past $3 in early 2025, the token is now under heavy pressure. XRP has fallen nearly 8% in the last 24 hours, more than 16% over two weeks, and over 44% since late January 2025. This move is not isolated. Bitcoin’s drop toward the $82,000 level has pulled the entire market lower, putting XRP back into defensive territory.
Where the Key Support Levels Sit
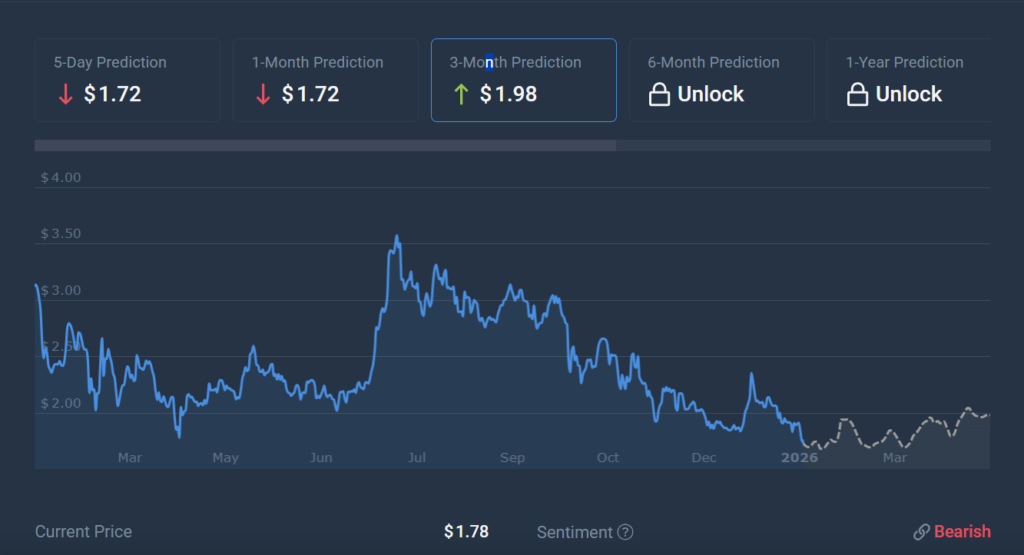
XRP last traded below $1 in November 2024, before momentum accelerated as the SEC lawsuit moved toward resolution. That legal clarity helped push XRP to a $3.65 peak in mid-2025. Since then, sentiment has reversed. XRP is now more than 50% off its highs. A sustained break below the $1.70 area could open the door to heavier selling, and if panic accelerates across crypto, a revisit of sub-$1 prices cannot be ruled out.
What Analysts Expect Next
Despite the volatility, not all outlooks are outright bearish. CoinCodex forecasts XRP entering a sideways phase rather than collapsing further. Their models suggest XRP could stabilize and attempt to reclaim the $2 level by April 2026. That said, forecasts assume broader market conditions do not deteriorate further. Continued macro pressure or another leg down in Bitcoin would challenge this scenario.
Macro Pressure Still Matters
Investor appetite for risk remains weak, and crypto continues to trade as a high-beta asset. If global markets stay defensive and liquidity remains tight, XRP could struggle to find sustained demand. The token’s fate in the near term is less about XRP-specific news and more about whether the wider crypto market can stabilize.
Conclusion
XRP falling below $1 is not the consensus outcome yet, but it is no longer unthinkable. Much depends on whether current support zones hold and whether Bitcoin can stop bleeding. For now, XRP sits at a crossroads between consolidation and another deeper leg down.