
- ADA has entered a potential breakout zone after a 13% rebound from the December low.
- RSI divergence, whale accumulation, and falling coin activity all support a reversal thesis.
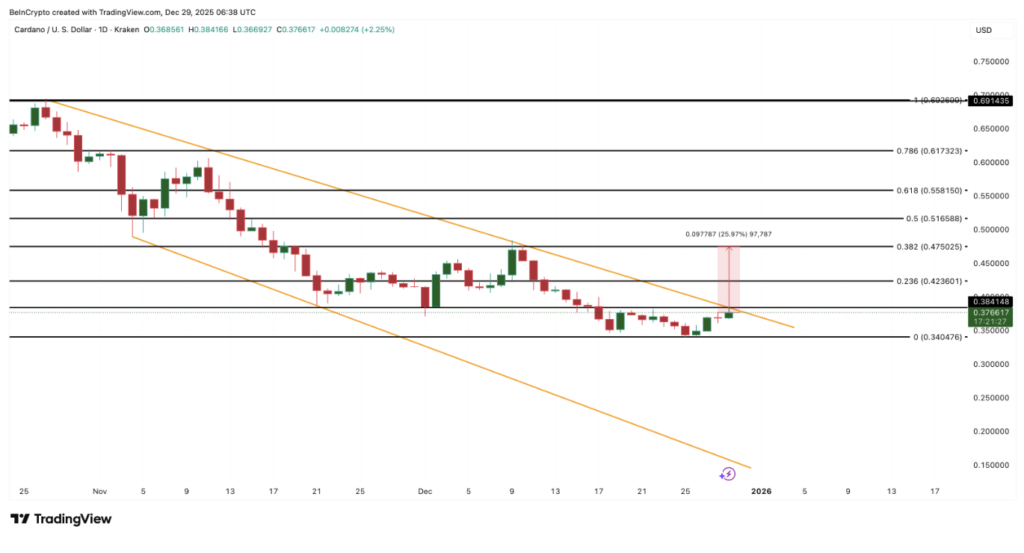
- A daily close above $0.38 and strength through $0.47 are needed to unlock the $0.69 target.
Cardano has quietly started to wake up. Since the December 25 low, ADA is up roughly 13%, pushing price into what now looks like a potential breakout zone. It’s still down close to 10% on the month, so this isn’t a full recovery yet, but the current move feels like more than just a reflex bounce. A few signals are lining up, and together they suggest the trend may be getting ready to turn, if price follows through.
A Falling Wedge Starts to Bend
For weeks, ADA was guided lower by a falling wedge that began forming in early November. That structure kept pressure on price, but it also set the stage for a possible reversal. Recently, ADA pushed up toward the wedge’s upper trendline, hovering near the breakout area around $0.38.
If a daily close clears that level, the pattern opens up a projected upside of roughly 79%, pointing toward the $0.69 region. That target comes from the height of the wedge itself, measured from the lowest swing to the highest internal swing, then projected upward from the breakout point. It’s a classic setup, and it only activates if the breakout actually confirms.
RSI Divergence Adds Weight to the Move
Momentum indicators are backing up the idea that sellers may be losing control. Between December 1 and December 25, ADA made a lower low on price, but the RSI printed a higher low over the same stretch. That’s a bullish divergence, and it usually shows up when downside momentum starts to fade, even if price hasn’t turned yet.
That divergence helped spark the current 12.8% bounce. More importantly, if ADA breaks and holds above $0.38, the RSI signal shifts from “relief rally” territory into potential trend-reversal territory. It’s a subtle distinction, but a big one.
Whales Buy While Coin Activity Cools
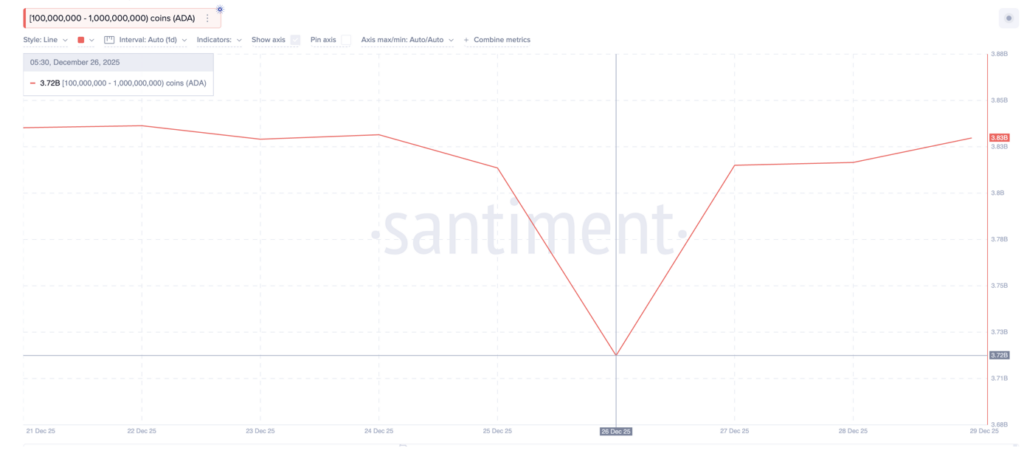
On-chain data adds another layer to the picture. Whales holding between 100 million and 1 billion ADA have been increasing their positions right as these technical signals appeared. On December 26, this group held about 3.72 billion ADA. That figure has since climbed to roughly 3.83 billion ADA, an increase of nearly $41 million.
Timing matters here. This accumulation started just after the RSI divergence flashed and continued as price approached wedge resistance. Whales tend to build positions before trends shift, not after headlines catch up.
At the same time, overall coin activity has dropped. The spent coins age band, which tracks how much older supply is moving back on-chain, fell from about 149 million ADA on December 27 to roughly 116 million ADA, a drop of around 22%. Fewer older coins moving usually means less sell pressure. When that lines up with whale accumulation, breakouts have a better chance of sticking.
The Levels That Decide Everything
Right now, ADA is trading near $0.38, and that level is the line in the sand. A daily close above it confirms the wedge breakout and opens room toward $0.42. Beyond that, $0.47 is critical. ADA failed to reclaim that level multiple times in November and early December, so taking it back would mark a real shift in structure.
If price can push above $0.51 and $0.55, momentum expands, and the $0.69 projection starts to look realistic rather than theoretical. On the flip side, a drop below $0.34 would weaken the breakout case and keep the falling wedge in play for longer.
ADA is sitting at its most important test in over a month. The structure hints at a reversal. Momentum supports it. Whales are buying, and coin activity is cooling. But until price confirms strength above $0.38 and follows through toward $0.47, it remains a setup, not a trend.