- XRP’s long-term indicators are showing rare signals that previously appeared near major market bottoms.
- A bullish RSI divergence on the daily chart suggests selling pressure is weakening behind the scenes.
- Key support near the $1.85–$1.90 range is holding for now, though broader momentum remains cautious.
XRP is starting to flash some pretty rare technical signals, the kind that usually show up when markets are tired of selling. On the three-week chart, the Stochastic RSI has dropped all the way to 0.00. That level has only appeared once before, right around the 2022 bear market bottom.
On higher timeframes, readings like this tend to suggest that downside momentum has mostly burned itself out. In simple terms, sellers may have already done the bulk of the damage. Back in 2022, a similar setup didn’t spark an instant rally, but it did mark the beginning of a long, quiet accumulation phase.
What stands out this time is behavior from longer-term holders. Instead of panicking, they appear to be absorbing supply. That kind of slow, steady buying often shows up near cycle lows, when risk feels high but value starts to look attractive.
This doesn’t guarantee a sudden bounce, of course. But it does suggest the risk of another sharp leg down is shrinking, and that XRP could be setting the groundwork for consolidation, or something more constructive later on.
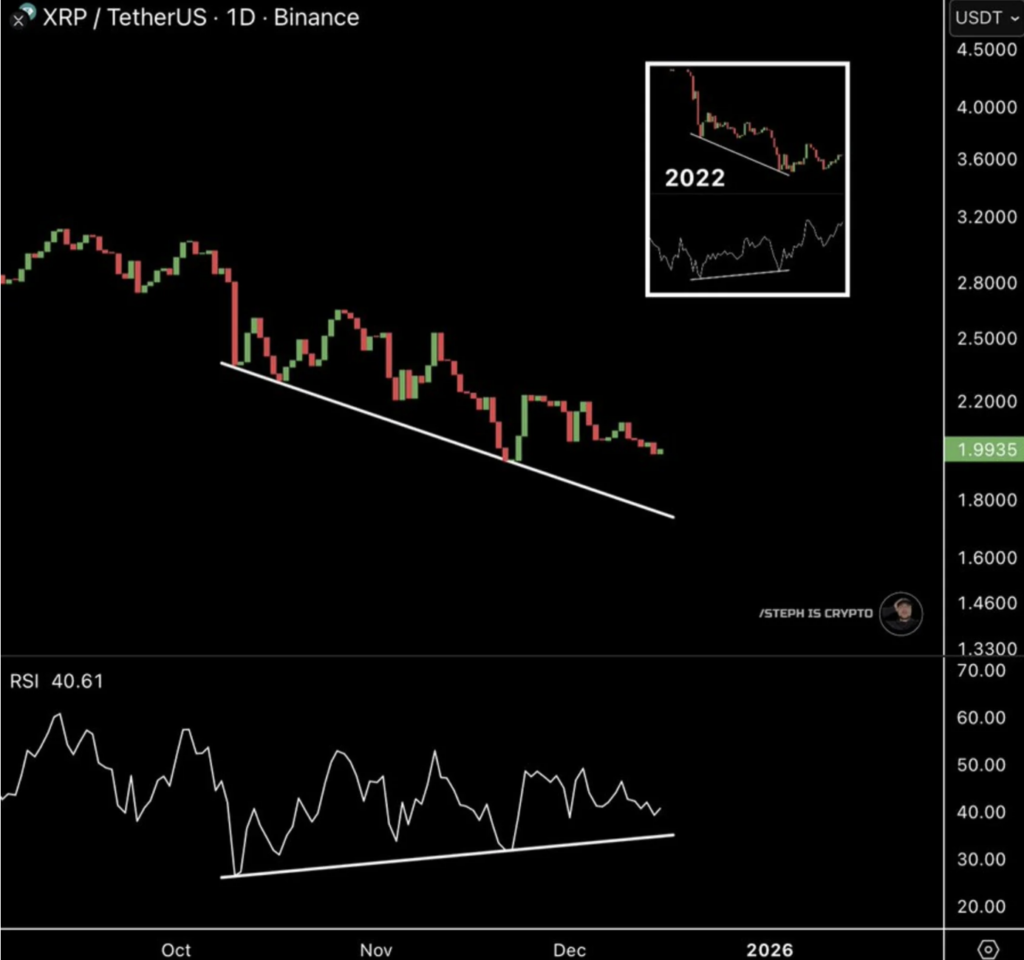
Daily Chart Prints a Rare Bullish Divergence
Zooming into the daily timeframe, XRP is showing a bullish RSI divergence, another signal that doesn’t appear often. The last time this happened was in 2022, when XRP was trading near $0.28. What followed wasn’t explosive right away, but stability came first, then a sustained uptrend over time.
A bullish divergence forms when price makes lower lows, but momentum indicators quietly start rising. It’s a sign that selling pressure is weakening, even if price hasn’t reacted yet. Think of it as exhaustion rather than excitement.
This kind of setup usually favors patient participants. It often shows that buyers are stepping in quietly, long before any obvious breakout grabs attention. No promises of a fast move here, but it’s one of the early clues traders tend to watch closely.
Weekly Structure Shows Support, but Caution Remains
On the weekly chart, XRP appears to have shifted from strong upside momentum into a more corrective phase. After the sharp rally in late 2024, price pushed toward the upper Bollinger Band, then rolled over and drifted lower.
Right now, XRP trades around the $1.91–$1.92 area, sitting below both the 20-week and 50-week EMAs. Still, the $1.85–$1.90 zone has started to stand out as an important support region. This area lines up with the lower Bollinger Band and the approaching 100-week EMA.
Several weekly candles show long lower wicks, which usually signals that buyers are defending this zone. That’s a constructive sign, even if momentum hasn’t flipped yet.
That said, the weekly MACD remains negative. This tells us the broader trend hasn’t fully reset. If support were to fail, XRP could still drift toward the 200-week EMA, roughly in the $1.35–$1.40 range.
For now, the picture is mixed but interesting. XRP isn’t screaming “bull run,” but it is quietly showing signs that the worst selling pressure may be behind it. Sometimes, that’s how the next phase begins.