- XRP has slipped below key long-term support as broader market weakness continues to weigh on sentiment
- Historical data shows XRP often stages recoveries after extended periods below the 50-week moving average
- Momentum indicators suggest selling pressure may be easing, though confirmation is still needed
XRP has been feeling the weight of the market for weeks now, and it shows. Since early October, broader crypto sentiment has deteriorated as macro uncertainty crept in, dragging the entire digital asset space lower. In that time, total crypto market capitalization shed more than $1.3 trillion, and XRP gave up tens of billions in value as selling pressure stayed firmly in control.
For much of the decline, XRP managed to defend the psychologically important $2 level. Once that floor cracked in mid-December, however, downside momentum accelerated and bearish sentiment hardened. Even so, some analysts argue this phase does not automatically imply long-term structural damage.
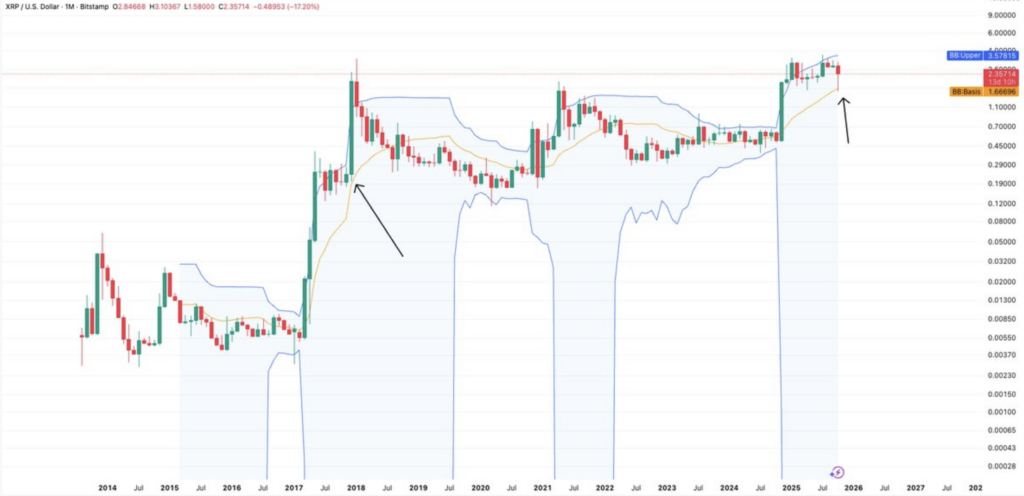
The Importance of the 50-Week Moving Average
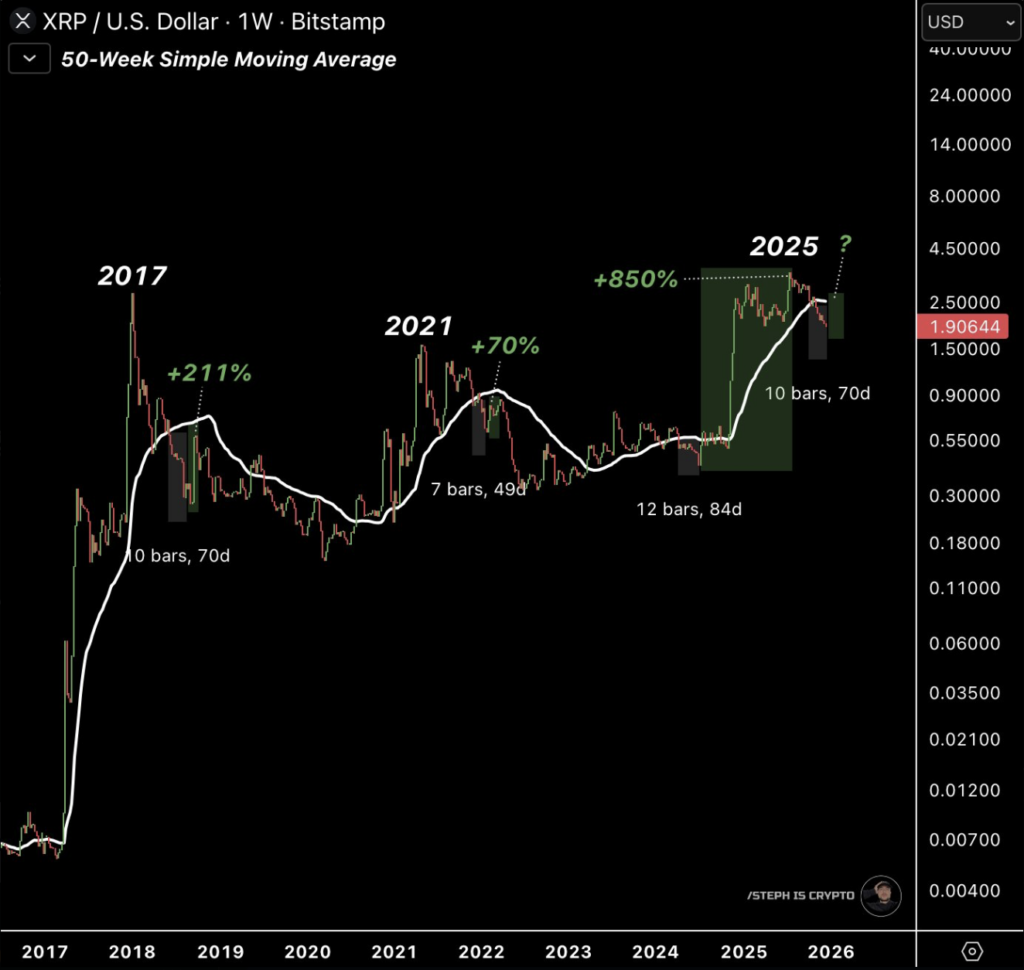
One level drawing increasing attention is XRP’s position relative to the 50-week simple moving average. Market analyst Steph highlighted that XRP has now spent multiple consecutive weeks trading below this long-term trend indicator. Typically, that reflects sustained selling pressure and weaker investor confidence.
At the same time, historical chart data adds context. XRP has previously remained below the 50-week SMA for extended stretches, often between 50 and 84 days, before staging notable recoveries. These past cycles form the basis for growing speculation that the current setup could be approaching a turning point.
What History Shows Since 2018
This technical structure has appeared several times over the years. After XRP’s sharp decline from its early 2018 peak, the asset spent weeks below the 50-week SMA. That period eventually gave way to a meaningful rebound later in the year.
A similar pattern emerged toward the end of 2021. XRP slipped below the same long-term average and remained there for several weeks before recovering in early 2022. While that rebound was more modest, it still marked a clear recovery from the local low.
The most recent example came in 2024. XRP stayed below the 50-week SMA for nearly three months before launching into a much stronger rally that carried price to new cycle highs. This instance has become a key reference point for analysts assessing the current phase.
How the Current Setup Compares
At present, XRP has been trading below the 50-week SMA for roughly ten weekly candles, a little over two months. If this cycle follows historical timelines, some analysts believe there may still be several weeks of pressure before a clearer reversal emerges. Matching the longest prior duration could extend this phase toward the end of the year.
Price projections based on earlier percentage moves vary widely and remain highly speculative. Analysts stress that broader market conditions, liquidity, and sentiment will ultimately determine the outcome.
Momentum Indicators Hint at Stabilization
Beyond moving averages, other technical tools are starting to draw attention. Analyst Chart Nerd noted that momentum indicators such as the Relative Strength Index and the Moving Average Convergence Divergence are showing signs that selling pressure may be easing.
These signals often appear during stabilization phases rather than at the exact moment of a reversal. While they do not guarantee an immediate rally, they can suggest that the most aggressive selling may already be behind the market.
A Familiar Pattern, but No Guarantees
XRP remains under technical strain, and caution is still warranted. However, historical data shows that similar periods of weakness have, at times, laid the groundwork for strong recoveries. While past performance does not ensure future results, XRP’s ongoing interaction with the 50-week moving average remains a focal point for traders watching for the next major shift in trend.